
8.2 Drainage from the Soil Profile
The strong forcings imposed at the soil surface by rainfall or irrigation events and by diurnal and annual cycles of solar radiation are typically moderated as we move deeper in the soil profile. As a result, the gradients in pressure potential are often smaller in magnitude at depth than they are near the soil surface. At sufficient depth, the pressure potential gradient may become negligible and the drainage rate can be approximated using the unit-gradient approach.
That approach begins with the Buckingham-Darcy Law
![\[ q=-K(\Theta)\frac{d(\Psi_g+\Psi_p)}{dz}=-K(\Theta)\left[ \frac{d \Psi_g}{dz}+\frac{d \Psi_p}{dz} \right] \]](https://open.library.okstate.edu/app/uploads/quicklatex/quicklatex.com-40df0037786556773531333eaeb61df2_l3.png "Rendered by QuickLaTeX.com")
(Eq. 8-1)
where q is the water flux, which in this case is the drainage rate; K(θ) is the hydraulic conductivity, which is a function of the volumetric water content, θ; d/dz indicates a gradient in the vertical direction, z, which is defined here as positive downward; ψp is the gravitational potential; and yp is the pressure potential. Assuming that the pressure potential gradient, the last term in Eq. 8-1, is negligible, and noting that dψg/dz = -1 when z is positive downward, we can simplify the Buckingham-Darcy Law in this case as:
![\[ q=K(\Theta) \]](https://open.library.okstate.edu/app/uploads/quicklatex/quicklatex.com-812dd304aa7d4926adbb6dc241ac8452_l3.png "Rendered by QuickLaTeX.com")
(Eq. 8-2)
This unit-gradient equation tells us that, when the pressure potential gradient is negligible at a specific depth in the soil profile, the downward drainage rate at that depth is equal to the hydraulic conductivity value associated with the soil water content at that depth. Here it is important to remember that the soil hydraulic conductivity has a strong, non-linear relationship to soil water content (recall Fig. 4‑7). Therefore, accurate drainage estimates from the unit-gradient approach require careful determination of that relationship.
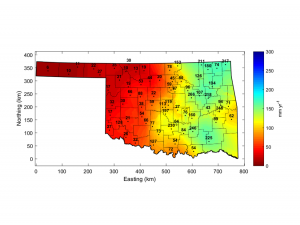
The unit-gradient approach has sometimes been employed to estimate groundwater recharge, on the assumption that water draining below the chosen measurement depth will eventually reach the groundwater table [3]. In a recent study in Oklahoma, the unit-gradient approach was applied to soil moisture data from a statewide monitoring network called the Oklahoma Mesonet [4].
Daily soil moisture data for the 60-cm soil depth were used in the Mualem-van Genuchten hydraulic conductivity function (Eq. 4-8). The soil parameters for that function were estimated using a pedotransfer function called Rosetta [5]. The resulting drainage estimates (Fig. 8‑3) reflect the gradient in annual precipitation, which ranges from approximately 1420 mm in the southeast part of the state to 430 mm in the western Oklahoma Panhandle. Annual drainage maps for specific years show large year-to-year fluctuations driven by differences in annual precipitation (link).
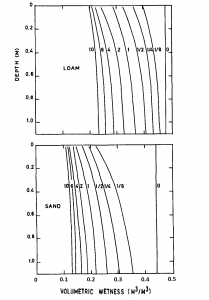
The rate and cumulative amount of drainage is influenced, not only by precipitation, but also by the soil texture. All other factors being equal, fine-textured soils exhibit lower drainage rates and less cumulative drainage than do coarse-textured soils. This is a direct result of the larger pore sizes typical in coarse-textured soils, leading to larger values for hydraulic conductivity at and near saturation, compared to those in fine-textured soils. Numerical simulations of the drainage process for uniform profiles of loam and sand (Fig. 8‑4) illustrate the dramatic effects of soil texture on drainage [6]. During the first day of drainage, the volumetric water content of the sand decreased from approximately 0.45 cm3 cm-3 to approximately 0.20 cm3 cm-3. During the same time interval, the loam exhibited much less drainage with the volumetric water content decreasing from approximately 0.47 cm3 cm-3 to approximately 0.35 cm3 cm-3. Even less drainage would occur for a clay soil under the same conditions.
In addition to the effects of soil texture, another key feature of the drainage process is evident in Fig. 8‑4. Notice that the drainage rates decreased over time, as indicated by the progressively smaller distances between the water content curves. However, there is no distinct time at which drainage ceased. Even after 6 days of drainage in a uniform sand, the water content continued to decrease and the drainage process continued. The fact that the drainage process typically does not have a distinct endpoint highlights a major problem with a widely-used concept in soil science, agronomy, and hydrology—the concept of “field capacity”.
