
13.5 Measured Soil Temperatures
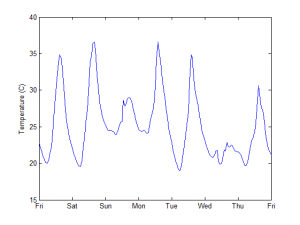
In reality, soil temperature oscillations often bear little resemblance to a regular procession of sine waves. Figure 13-8 shows one week of measured soil temperatures for the 6-cm depth under perennial vegetation in Minnesota, USA. After two days of similar and near-sinusoidal oscillations, the temperatures on the third day reflect a much smaller amplitude and a more irregular temperature pattern. The temperature oscillations on the fourth and fifth days could be reasonably approximated by a sine wave, but on the sixth day again the pattern is disrupted. Soil temperature sequences like this are not uncommon and typically result from changes in the weather, in this case rainy days in the midst of the growing season.
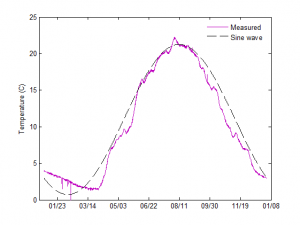
As the measurement depth increases, the impacts of short-term weather changes are damped out, and the soil temperature oscillations more frequently reflect a sinusoidal pattern. One year of measured soil temperatures at the 1-m depth for the same site in Minnesota are shown in Fig. 13‑9. The data are well-approximated by a sine wave for the majority of the year. The largest deviations from sinusoidal behavior were during the winter and may have been caused by the insulating effects of snow cover on the soil surface and by soil freezing/thawing at depths above 1 m.
