
2.5 Soil Aggregate Scale
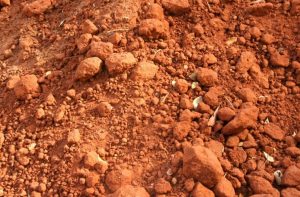
When we look closer still, we can see that the soil solids are often organized into three-dimensional assemblages ranging in size from approximately 0.1 to 10 cm. These assemblages are called aggregates, and their presence and characteristics are the defining features of what is commonly called soil structure. Small, rounded, highly-porous aggregates are indicative of soil structure that is well-suited for plant growth; whereas, large, angular aggregates with low porosity indicate structural conditions that are likely to limit plant growth. Often,a wide array of different aggregate sizes are present in a soil at the same time, as illustrated by the photo below. Soil structure and soil aggregates can change over time and are often altered, for better or worse, by human management practices such as tillage, crop planting, or preparing soil for construction projects. Properly-timed tillage practices using suitable implements can improve soil structural conditions near the surface, but these improvements are often temporary. Poorly-timed tillage or traffic by equipment or livestock can degrade soil structure resulting in surface or subsurface compacted layers that may last indefinitely.
Soil aggregate size distributions can be measured while the aggregates are either wet or dry, depending on the purpose of the measurement. Researchers often use a stack of sieves to measure the size distribution of aggregates remaining intact after soaking and shaking initially dry aggregates of a specific size range (e.g. 4-8 mm) in a dilute solution. This process gives the size distribution of water stable aggregates which is intended to represent a soil characteristic called aggregate stability.
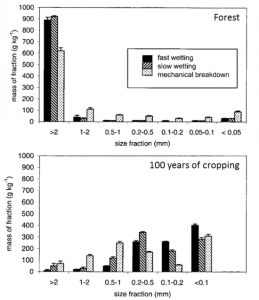
Fig. 2‑8 shows size distributions of water stable aggregates for two soils in France [3]. The soil from the forest had greater aggregate stability as shown by the fact that the >2 mm size fraction dominates the distribution. The cropland soil had lower aggregate stability as shown by the larger mass fractions in the smaller size classes (<2 mm), and data from other sites showed that the aggregate stability was lower the longer the soil had been farmed. This trend of decreasing aggregate stability was likely due to a similar decreasing trend of soil organic carbon which varied from 52.6 g kg-1 for the forest soil to 8.4 g kg-1 for the soil which had been farmed for 100 years. These data illustrate the general tendency for aggregate stability to increase as soil organic carbon increases. Soils with higher aggregate stability are typically less susceptible to surface crusting and erosion by natural rainfall, topics addressed in a later chapter.
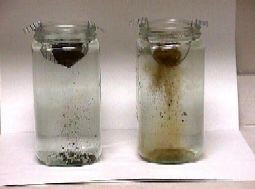
For educational purposes, a simpler procedure can be used to demonstrate aggregate breakdown due to wetting or to show differences in aggregate stability between soils (Fig. 2‑9). For this photograph, two initially dry aggregates from different soils were immersed in water. The aggregate on the left is more stable in water and thus loses less soil than the aggregate on the right. The darker color and greater stability of the aggregate on the left suggest that it has higher soil organic matter content than the one on the right.
Aggregate size distributions are also commonly measured by sieving air-dried soil samples, and the results are intended to represent the aggregate sizes existing in the field at the time of sampling, apart from the influence of rain or water. One way of summarizing the aggregate size distribution of a soil is by calculating the geometric mean diameter (GMD) using
![GMD = \exp \left[ \left( \sum\limits_{i = 1}^n W_i \ln \bar{X}_i \right) \middle/ \sum\limits_{i = 1}^n W_i \right]](https://open.library.okstate.edu/app/uploads/quicklatex/quicklatex.com-8019a04fc373d58e3e56dbf421dc340c_l3.png "Rendered by QuickLaTeX.com")
(Eq. 2-1)
where Wi is the mass of aggregates in size class i of n total size classes each with average diameter . The GMD provides a single number which can be used to compare the aggregate size distributions between various soils.
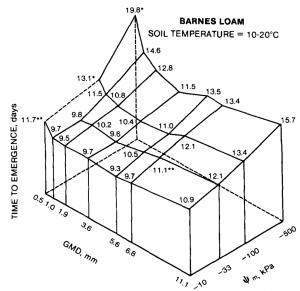
The dry aggregate size distribution of the surface soil can influence the suitability of the soil as a seedbed for crops and the susceptibility of the soil to wind erosion. For example, the time from planting to emergence of corn seedlings was influenced by the aggregate size distribution with earliest emergence occurring when the GMD was between 1.0 and 6.8 mm during growth chamber experiments using soils from the Midwestern US (Fig. 2‑10, [4]). The best tillage and planting procedures should be the ones that result in GMD values in the optimal range, which may be soil specific.
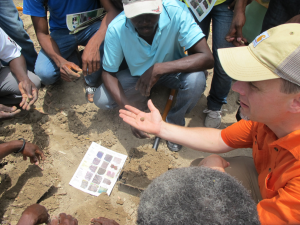
However, most farmers do not have easy access to the equipment needed to evaluate the aggregate size distribution of their soil, so GMD may be of limited practical value in evaluating soil management practices. More practical approaches for land managers utilize simple tools such as spades and rulers and rely on human sight and touch. One such method which has proven useful in several nations around the world (Fig. 2‑11) is called Visual Evaluation of Soil Structure [5]. In this method, the evaluator removes an intact slab of soil spanning roughly the top 20-cm, follows a step-by-step process to carefully observe the structure of that slab in the field, and then assigns a soil structural quality score to either the whole slab or noticeable layers within the slab using a reference card with photographic examples and key diagnostic criteria. (If you print this card for your own use, note that the measuring scale along the edge may not be accurate due to automatic rescaling of the page to your paper size.) In these instructive videos, Dr. Bruce Ball and Dr. Rachel Guimarães demonstrate the visual evaluation of soil structure for a compact soil and a loose soil. The soil structural quality scores resulting from this procedure have proven to be more strongly correlated with crop yields than are more traditional quantitative measures of soil physical properties such as penetration resistance and bulk density [6].
