
13.4 Sub-Surface Soil Temperatures
We can also approximate the oscillations of subsurface soil temperatures as a sine wave if we assume:
- the surface temperature is (and has been) oscillating as a sine wave,
- the average soil temperature is the same for all depths, and
- deep in the soil the temperature is constant.
Under these conditions, the soil temperature for any depth (z) and time (t) is given by:
![\[ T(z,t)=T_a_v_g+A_0e^-^z^/^dsin(\omega t+\phi-z/d) \]](https://open.library.okstate.edu/app/uploads/quicklatex/quicklatex.com-2f9c4f3cd8f47feef6e3529743713b3d_l3.png "Rendered by QuickLaTeX.com")
(Eq. 13-4)
where e is the base of the natural logarithm and d is called the damping depth.
The damping depth is the depth at which the amplitude of the soil temperature oscillation is only 37% (1/e) as large as the amplitude at the soil surface. The damping depth depends on the soil thermal diffusivity (α) and the angular frequency (ω) or period of the oscillation.
![\[ d=\sqrt{2\alpha/\omega}=\sqrt{\alpha \cdot period/\pi} \]](https://open.library.okstate.edu/app/uploads/quicklatex/quicklatex.com-65017cb8a39e07c76045394db35f916a_l3.png "Rendered by QuickLaTeX.com")
(Eq. 13-5)
The damping depth equation above helps us see that the soil temperature oscillations associated with the annual cycle (period = 365 days) penetrate deeper in the soil than those associated with the daily cycle (period = 1 day). In fact, the annual oscillations penetrate approximately 19.1 times further ( ) than the daily oscillations. The penetration depth also increases as the thermal diffusivity increases.
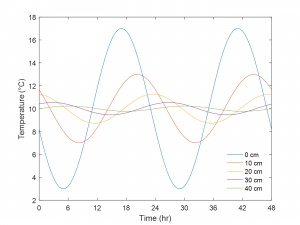
Plotting Eq. 13-4 helps us to visualize some fundamental aspects of soil temperature dynamics. Figure 13-6 shows the soil temperature dynamics simulated using Eq. 13-4 for transmission of a daily temperature wave in a soil with a thermal diffusivity of 0.50 x 10⁻⁶ m2 s-1 (18 cm2 h-1) and damping depth of 11.7 cm. First, you can see that the amplitude of the soil temperature oscillation decreases exponentially with depth (Fig. 13‑6). In this example, the amplitude, which was 7 °C at the soil surface, is only 3 °C by the 10-cm depth. Second, you can see that the maximum (and minimum) temperatures occur progressively later as the soil depth increases. In this example, the soil temperatures at 30 and 40 cm reach their respective maximums during the night or early morning, when the surface temperature is near its minimum. Third, you can see that the depth at which the soil is warmest (or coldest) changes constantly, with each of the plotted depths being the warmest depth in the soil profile for at least a small portion of the day.
The time lag that we observed in Fig. 13‑6 can be estimated using the following equation:
![\[ t_2-t_1=\frac{z_2-z_1}{\sqrt{4\pi \alpha/period}} \]](https://open.library.okstate.edu/app/uploads/quicklatex/quicklatex.com-7819683d37d5bc5b0bb770c3b75ddab1_l3.png "Rendered by QuickLaTeX.com")
(Eq. 13-6)
where t2–t1 is the time lag for transmission of the temperature wave between depths z2 and z1. As the thermal diffusivity increases, the time lag between successive depths decreases. In fact, this equation provides on way of estimating the thermal diffusivity. By recording the times at which daily maximum (or minimum) temperatures occur for two different soil depths, we can estimate the thermal diffusivity for the soil between those depths.
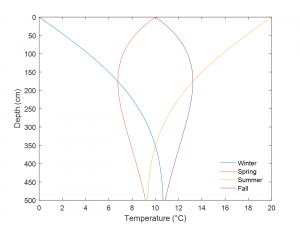
We can also use Eq. 13-4 to visualize soil temperature versus depth at defined times. During the winter, the coldest temperature is at the soil surface, and the soil heat flux is upwards towards the surface, i.e. negative (Fig. 13‑7). When the soil begins to warm up in the spring, the coldest temperatures are located neither at the surface nor at the bottom of the profile but rather in the middle, in this case near the 175 cm depth. The profiles in the summer and fall are mirror images of the winter and spring profiles, respectively. The same thermal diffusivity value was used for Fig. 13‑7 as for Fig. 13‑6, but since the former is for annual temperature oscillations the damping depth increases to 224 cm. Keep in mind that these profiles are based on several simplifying assumptions, and they neglect any influences of soil heterogeneity, convective heat transfer, or soil freezing/thawing.
