
7.1 Overview of Runoff and Water Erosion Processes
Before runoff (sometimes called overland flow) begins, there must be excess water on the soil surface. Conceptually, that excess water can occur for one of two reasons:
- the soil is unsaturated but the rate of water delivery to the surface exceeds the infiltration rate into the soil, this is called infiltration-excess overland flow, or
- the soil is saturated (or satiated) and cannot accept any more water, this is called saturation-excess overland flow.
In either case, runoff does not begin immediately upon the generation of the first excess water. The soil surface is never perfectly smooth, and the soil roughness results in a finite surface storage capacity, which is the volume of excess water per unit area that can be retained on the surface. Runoff can only begin once the surface storage capacity is exceeded.
When runoff occurs, the soil surface is susceptible to water erosion, i.e. erosion due to flowing water. The erosion process includes three primary stages: detachment, transport, and deposition. At the soil surface, detachment of soil particles from the bulk of the soil body can occur due to raindrop impact, the breakdown of soil aggregates upon wetting, and the scouring force of surface runoff. The rate of detachment during water erosion depends on:
- the degree to which the soil surface is covered by vegetation, plant residues, or other protective covers,
- the soil strength (recall Fig. 5‑9),
- the rainfall intensity,
- and the velocity of the surface runoff.
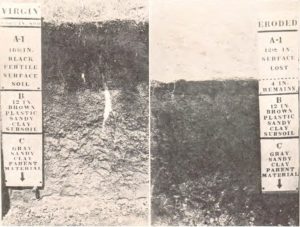
The transport of water and sediment, i.e. detached soil particles, across the soil surface during a runoff event often follows distinct patterns, which represent different types of water erosion. The first type is sheet erosion, which is characterized by water flow and soil erosion distributed relatively uniformly across the soil surface. This type of erosion can be particularly insidious, sometimes going relatively unnoticed for years and causing major soil degradation. The images in Fig. 7‑3 show an example where >30 cm of topsoil were lost to sheet erosion, effectively destroying the productive capacity of the soil.
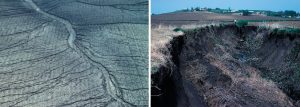
When water and sediment flowing across the surface first begin to concentrate in small, shallow channels, the result is rill erosion. As the water continues to flow downhill, rills may deepen and widen to form gullies, resulting in gully erosion. Rills are distinguished from gullies in that rills can often be removed using tillage and are easily crossed with field equipment, while neither of these is true for gullies. The distinction between rill and gully erosion is illustrated in Fig. 7‑4.
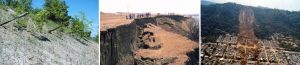
Other types of water-related erosion are driven by the force of gravity acting on wet soil along hillslopes, gullies, and streambanks. As soil in these locations becomes thoroughly wetted, the weight of the soil body increases and the soil strength decreases raising the risk of gradual soil creep, sudden slumps, and potentially devastating landslides (Fig. 7‑5). On January 13, 2001, a 7.6 magnitude earthquake struck El Salvador, setting off a massive landslide that killed ~585 people in the residential area of Santa Tecla. Wet soil is thought to have been a key factor contributing to this tragedy.
The final stage of the erosion process is sediment deposition. Sediment deposition is a major issue affecting streams, reservoirs, and coastal areas. It is also one of the primary drivers of the dramatic spatial variability found in alluvial soils. Sediment control is an important management concern in agriculture, construction, and engineering. Sediment deposition is typically initiated by a decrease in the flow velocity and can be approximated using Stokes’ Law (Eq. 2-2).
The three stages of water erosion as a function of flow velocity are depicted for different particle sizes in a helpful diagram called the Hjulström-Sundborg diagram (Fig. 7‑6). Based on work of researchers at the University of Uppsala in Sweden, this diagram summarizes the behavior of particles in a stream or river [3]. Erosion in this context means the detachment of a particle from the streambed. Note that both axes have a logarithmic scale. Several interesting features of erosion, transport, and deposition processes can be seen by carefully inspecting the diagram.
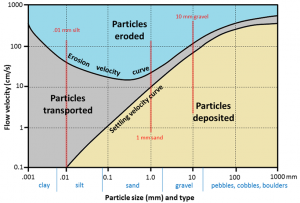
For example, we can see that a water flow velocity of roughly 20 cm s-1 is required to detach a 1-mm sand-sized particle from the streambed [4]. However, once that particle is detached, it will remain in suspension and be transported by the flowing water until the flow velocity drops below 10 cm s-1. The diagram also shows that sand size particles in the range from approximately 0.2-0.5 mm (fine to medium sand) have the lowest detachment velocity and are thus most erodible. The detachment velocity increases for smaller particle sizes, such as silt and clay, because the attractive and adhesive forces between the particles increase as the particle size decreases. Finally, the diagram highlights the fact that clay size particles, once detached and suspended, will not be deposited but will remain in suspension indefinitely even at flow velocities as low as 0.1 cm s-1.
