11.4 Transpiration and Soil Water
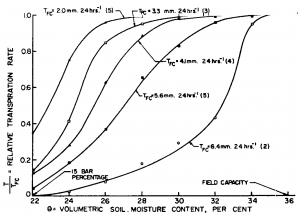
Since we cannot easily monitor the water status of the rhizosphere soil itself, for practical purposes, we often seek to understand and manage the relationship between transpiration and the bulk soil water. Several of the main features of that relationship are reflected in the data shown in Fig. 11‑4, which is taken from a classic study on transpiration rates of corn [2]. The experiment involved corn grown in the field in 136 large containers that were individually watered to achieve a range of soil water contents for every day of the experiment. As the weather conditions, and evaporative demand, varied from day-to-day, transpiration rates for the well-watered corn varied from as low as 1.4 mm d-1 up to ~7 mm d-1. The relative transpiration rate was defined as the ratio of the transpiration rate for the corn in a particular container to the transpiration rate of the corn in the well-watered containers on the same day. When the soil water content fell below a certain level, the relative transpiration rate decreased approximately linearly with further declines in soil water content. However, this critical soil water content value depended upon the evaporative demand, as indicated by the transpiration rate of the well-watered corn. When the well-watered transpiration rate was 6.4 mm d-1, the relative transpiration rate declined once soil water contents dropped below 0.34 cm3 cm-3 in this Colo silty clay loam. Under conditions of lower evaporative demand when the well-watered transpiration rate was 2.0 mm d-1, the relative transpiration rate did not decline until soil water content dropped below 0.25 cm3 cm-3. These data show how both evaporative demand and soil water status interactively influence the process of transpiration.