
5.1 Precipitation
As we saw in the previous chapter, one of the earliest cornerstones of soil physics was laid in 1856 by the French engineer, Henry Darcy, whose work focused on water filters and groundwater aquifers. Shortly thereafter a German, Ewald Wollny, became perhaps the first scientist whose published work focused squarely on soil physics. Wollny’s experiments as early as 1874, were the first to quantitatively describe how raindrops falling on bare soil degraded the soil structure and how the vegetative canopy provided a vital protection against raindrop impact [1]. His subsequent experiments revealed that the vegetative canopies of common crops could intercept from 12-55% of the total rainfall. These discoveries, and his subsequent studies on runoff and erosion, make Wollny one of the pioneers of soil physics and hydrology and an early leader on the important issue of soil and water conservation. Our study of soil water balance process will begin where Wollny, and arguably soil physics itself, began – by considering precipitation and the interactions between raindrops, vegetative canopies, and the soil.
5.1.1 Precipitation Amount

The global pattern of precipitation amounts over land is arguably one of the most important influences on the Earth’s coupled human and natural systems. Average annual precipitation ranges from <100 mm in the great deserts of the world to >2000 mm in the equatorial rainforests (Fig. 5‑2). In fact, average annual rainfall exceeds 5000 mm (16 feet!) in a few locations, such as eastern India, where mountains lift warm, moist ocean winds cooling the air and resulting in precipitation. This process of orographic lift produces relatively high precipitation amounts on the upwind side of the mountains and relatively low precipitation areas, known as rain shadows, on the downwind side. The Earth’s precipitation patterns are clearly reflected, not only in the global distribution of natural ecosystems, but in the patterns of human population, as well (Fig. 5‑3). The majority of the world’s cities with >1,000,000 people are located in regions with average annual rainfall between 500 and 2000 mm. If climate change produces substantial changes in precipitation patterns, then shifts in human population patterns or increased water transfers by humans or both are likely to result. In fact, large scale water transfer projects have already begun, such as the enormous “South-to-North Water Diversion” project in China, which allows transfer of 25 x 109 (109 = billion) cubic meters of water per year from the Yangtze River basin in south China to Beijing and other locations in north China across a distance of more than 1,000 km [2].

5.1.2 Precipitation Intensity
The afternoon of June 22, 1947, was warm and humid in Holt, Missouri, a small farming community northeast of Kansas City, and a rainstorm, which had dropped 10-60 mm of rain across eastern Nebraska and Kansas, was approaching from the northwest [3]. The residents of Holt had no way of knowing that this storm would rapidly intensify and drop 305 mm (12 inches) of rainfall on their community in a span of only 42 minutes, setting a world record for precipitation intensity and filling their homes with up to 60 cm of water and mud [4]. This record rainfall intensity for a duration of 42 minutes is equivalent to 43.6 cm h-1. This extremely high rainfall rate is far greater than the rates at which water can enter, i.e. infiltrate, most soils.
The world record precipitation intensities for other durations are equally incredible. As much as 38 mm have fallen in a single minute (Table 5‑1)! Clearly atmospheric processes are capable of generating precipitation intensities far greater than the capacity of the soil to transmit that water. And, the kinetic energy delivered to the land surface by these intense rainfall events can be substantial. For rainfall intensities of 10 cm h-1 the kinetic energy of the falling rain can approach 10,000 J m-2 h-1 [5]. Thus, Wollny was correct in recognizing the critical role of the vegetative canopy and plant residues in protecting the soil from the erosive energy of rainfall.
Table 5‑1. World-record precipitation depths for durations ranging from 1 minute to 1 year. These data were current as of 2003 and were obtained from the US National Weather Service and reported by Galmarini et al. (2004).
| Duration | Amount | Location | Date |
| mm | |||
| 1 minute | 38 | Barot, Guadeloupe | 26 Nov 1970 |
| 1 hour | 401 | Shangdi, Inner Mongolia, China | 3 Jul 1975 |
| 1 day | 1,825 | Foc Foc, La Réunion | 7-8 Jan 1966 |
| 1 month | 9,300 | Cherrapunji, India | Jul 1861 |
| 1 year | 26,461 | Cherrapunji, India | Aug 1860–Jul 1861 |
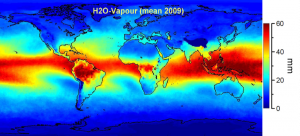
The record rainfall totals for durations greater than a few minutes far exceed the amount of water that the atmosphere can hold in one location, proving that extreme rainfall events depend on strong horizontal transport of water vapor into the rainstorm from the surrounding atmosphere [6]. If all the atmospheric water vapor above a given land area were condensed and deposited on the land surface so it could be measured, that depth of water would be equal to what atmospheric scientists call the total column water vapor or total precipitable water. The annual average of this precipitable water ranges from near 60 mm over portions of the equatorial oceans and the Amazonian rain forest to near 0 mm in the rain shadows of the Himalayas and Andes mountains (Fig. 5‑4). Understanding that the atmosphere typically holds less than 60 mm of precipitable water at any one place and time makes the record precipitation intensities in Table 5‑1 all the more incredible.
5.1.3 Raindrop Size Distribution
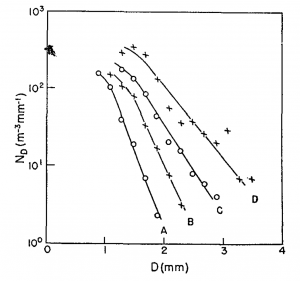
Closely related to rainfall intensity is raindrop size. Raindrops typically have cross-sectional diameters between 1 and 4 mm [7], and the size distribution shifts toward larger drops as the rainfall intensity increases (Fig. 5‑5). The minimum diameter of raindrops is approximately 0.5 mm because smaller droplets are generally kept aloft by air currents. Although raindrops with equivalent diameters up to 9 mm have been observed [8], such large drops are generally unstable. The drag forces and pressures acting on a large drop as it falls result in the flattening of the drop, followed by deformation into a short-lived, parachute-like shape, and ultimately the complete disintegration of the drop. This disintegration has been captured in striking high-speed video footage available here. In fact, this process of fragmentation of large drops may generate the entire distribution of raindrop sizes [9].
