
5.4 Crust Formation
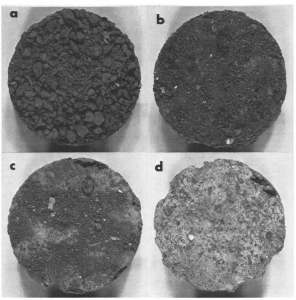
A soil crust is a relatively thin layer at the soil surface which has a higher bulk density, a reduced number of large pores, and a lower hydraulic conductivity than the underlying soil. Fig. 5‑10 illustrates the dramatic changes that can occur at the soil surface during raindrop impact and crust formation [25]. During the first stage of crust formation under simulated rainfall (panel b), the aggregates at the surface of this silty clay loam soil were broken down into smaller particles as their soil water content increased and soil strength declined. In the second stage of crust formation (panel c), much of the relatively fine material resulting from the aggregate breakdown was removed from the surface by soil splash and runoff. Some soil particles also flowed with the infiltrating water into the pores of the surface layer, where they were deposited thus lowering the porosity. In the third and final stage of crust formation (panel d), the surface was devoid of loose material, a cohesive surface layer had formed, and the rate of soil splash declined.
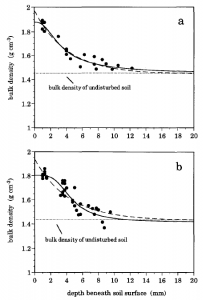
These crust forming processes alter, not only the soil surface, but a layer which can extend >1 cm beneath the surface. For example, 2 h of simulated rainfall at a rate of 30 mm h-1 resulted in a zone of increased bulk density extending to a depth of ~15 mm for a loamy sand and a sandy loam from Germany [26]. The bulk density reached maximum values of approximately 1.90 g cm-3 near the soil surface, an exceptionally high density relative to the 1.45 g cm-3 of the underlying soil (Fig. 5‑11). The high bulk density, low porosity, and the absence of large pores in the crust can greatly reduce the hydraulic conductivity of the surface soil. For instance, the hydraulic conductivity of the surface soil was reduced to <20% of its initial value following 20 minutes of simulated rain at 50 mm h-1 on four soils from Georgia that were susceptible to crusting [27].
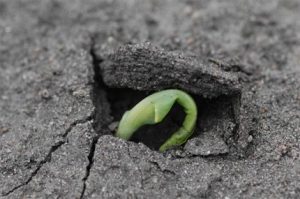
Soil crusts have a diverse array impacts. Seedling emergence can be delayed or prevented entirely by soil crusts (Fig. 5‑12). One way to characterize a soil crust is by its penetration resistance, which is an indicator of soil strength and can be measured relatively easily with a hand-held penetrometer (link). As the penetration resistance of soil crusts increased from 300 kPa to 900 kPa, cotton seedlings’ emergence was reduced from ~60% to ~25% in one study in Texas [28]. Soil crusts can also reduce the rate of infiltration into the soil.
Two primary mechanisms of soil crust formation are physical dispersion and chemical dispersion of soil aggregates. Chemical dispersion and the factors contributing to chemical dispersion have been discussed in section 4.5. Physical dispersion is the breakdown of soil aggregates caused by raindrop impact, by rapid rewetting of initially dry aggregates (recall Fig. 2‑9), or by mechanical disturbance such as tillage. The degree of physical dispersion is influenced by both the severity of the disruptive forces and by the stability of the soil aggregates.
