3.3 Soil Water Retention
If you have ever taken a walk along a sandy beach, you probably observed that there is a place quite near the water’s edge where the ground is dry enough and firm enough to easily walk on. In contrast, if you have walked along the edge of a lake or pond where the surrounding soil was fine-textured, you probably found that the ground near the water’s edge was wet and muddy. The differences you experienced in those two cases can be partly explained by the differing capabilities of coarse- and fine-textured soils to retain, or store, water. These capabilities are described by a relationship called the soil water retention curve. The soil water retention curve is the relationship between soil water content and matric potential. Understanding this relationship is crucial to understanding processes such as soil water storage, water flow, and plant water uptake.
3.3.1 Features of Soil Water Retention Curves
The most fundamental concept to understand about soil water retention is that soil water content is positively related to soil matric potential. As soil water content decreases, matric potential also decreases, becoming more negative. When all the pores in a soil are filled with water, the soil is at its saturated water content (θs) and the matric potential is 0. Consider the water retention curve for the Rothamsted loam shown in Fig. 3‑6. The intersection of the solid curve with the left-hand y-axis shows that for this soil θs is approximately 0.51 cm3 cm-3.
As we move to the right along the solid curve, we are moving toward more negative values of matric potential. The absolute value of matric potential, rather than matric potential itself, is plotted on the x-axis in this figure, as is common for water retention curve plots. The absolute value of matric potential is sometimes called suction. Using the absolute value for matric potential allows us to use a logarithmic scale for matric potential to compensate for its large numerical range relative to that of soil water content.
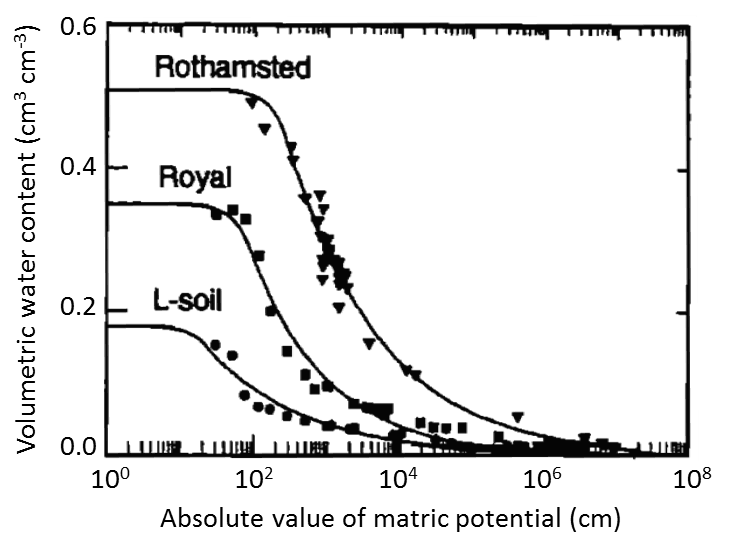
The water retention curve for the Rothamsted loam is flat between 100 cm (i.e. 1 cm) and approximately 102 cm (100 cm), then at lower matric potentials the curve bends downward. The highest matric potential at which air has displaced water in some of the pores of a previously saturated soil is called the air-entry potential (ψe). For this Rothamsted loam the air-entry potential was estimated to be -128 cm of water.
As we follow the water retention curve toward the right from the air-entry potential, we encounter a region where the decrease in water content is relatively large for each corresponding decrease in matric potential. There is a subtle inflection point approximately halfway down the descending limb of the water retention curve where the shape changes from concave to convex. The location of this inflection point may have some practical significance for soil management. The water content at this inflection point may be the optimum water content for tillage, resulting in the greatest proportion of small aggregates [17], and the slope of the curve at the inflection point may be a useful indicator of soil quality [18].
To the right of the inflection point, the steep portion of the curve tapers off into a relatively flat portion of the curve when the matric potential takes on large negative values. In this tail of the water retention curve, large decreases in matric potential are associated with only small decreases in soil water content.
3.3.2 Soil Properties Affecting Soil Water Retention
Another fundamental characteristic of soil water retention curves is that coarse-textured soils retain less water than fine textured soils at the same matric potential. Consider the substantial differences in the curves for the sand (L-soil), sandy loam (Royal), and loam (Rothamsted) textured soils in Fig. 3‑6. The sand exhibits a much lower saturated water content than the loam, in this case 0.18 cm3 cm-3 versus 0.51 cm3 cm-3. The sand also has a higher (less negative) air-entry potential than the loam, -32 cm versus -128 cm. The water retention for the medium-textured sandy loam soil is intermediate between those of the other two soils. Throughout the subsequent chapters, one common theme will be how these substantial differences in water retention between different soil textures dramatically influence water movement, plant growth, and related processes in both managed and natural ecosystems.
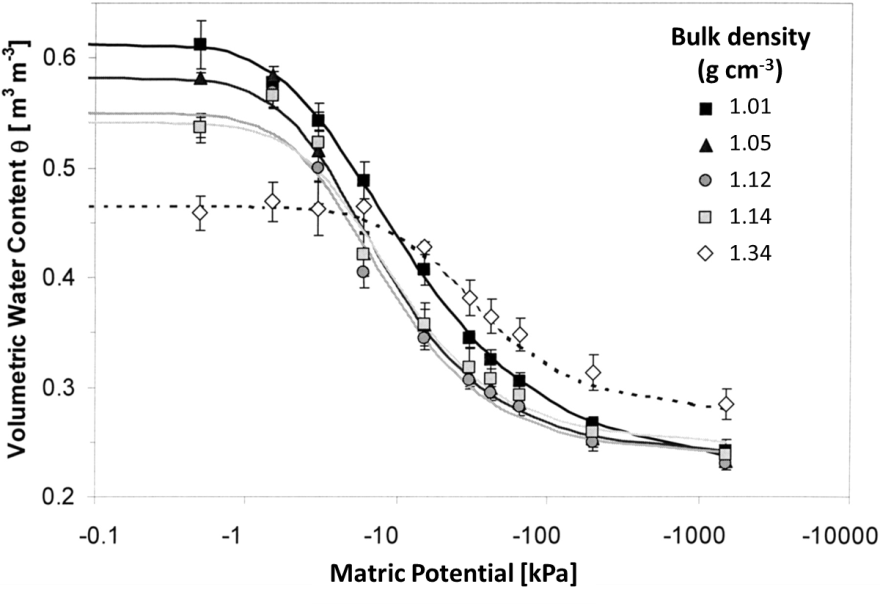
A secondary influence on soil water retention is the soil bulk density (Fig. 3‑7). If you compare compacted and un-compacted samples of the same soil, the compacted soil will typically have a lower porosity, lower saturated water content, and lower air-entry potential. Sufficiently compacted soils can also have higher water contents for matric potentials below the air-entry potential than a similar un-compacted soil. This pattern is evident for the samples with the highest bulk density in Fig. 3‑7 [19].
Advocates for conservation tillage, cover crops, soil quality, and, more recently, soil health have often stated that increasing soil organic matter improves soil water retention. However, the scientific evidence for this claim is somewhat unclear. While a number of studies have found that increasing organic matter increases soil water retention, a similar number of studies have found no such effect [20]. One plausible hypothesis is that in some soils increasing organic matter results in decreased bulk density, leading indirectly to positive effects on water retention similar to those shown in Fig. 3‑7.
3.3.3 Hysteresis in Soil Water Retention
The soil water retention curve can also be influenced by whether the soil is undergoing wetting (sorption) or drying (desorption). When the soil water retention curve differs between wetting and drying, that phenomenon is called hysteresis. This phenomenon has a number of important effects on soil water dynamics. For example, hysteresis in the water retention curve can increase the amount of water that is stored near the soil surface after an infiltration and drainage event [21]. Hysteresis can also slow the rate of solute leaching in soil under natural rainfall conditions with greater effects in coarse-textured than fine-textured soils [22]. In subsequent chapters, we will further consider the effects of hysteresis. For now, we will examine its nature and causes.
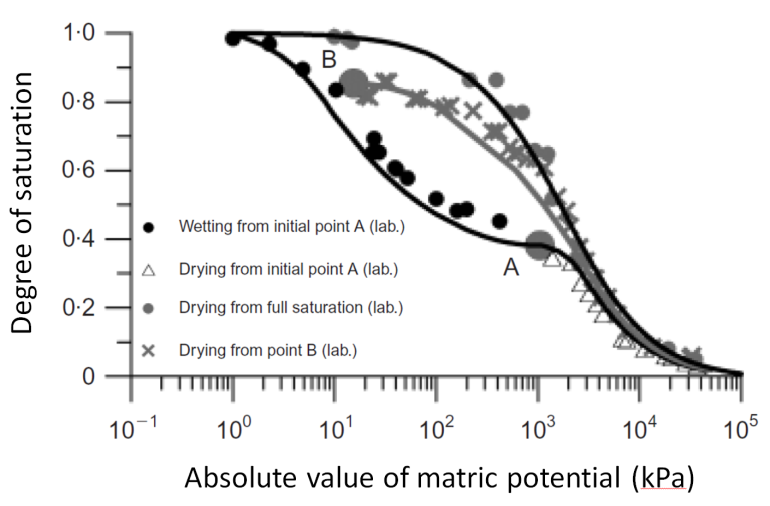
For a soil exhibiting hysteresis, the equilibrium water content associated with any particular matric potential will be lower for a wetting curve than for a drying curve (Fig. 3‑8). The initial water content for the wetting or drying process also plays a role. Notice in Fig. 3‑8 the clear difference in the drying curve for the silty clay loam soil when the drying process began from full saturation compared to when the drying process began at a lower water content indicated by the point labeled “B” [23].
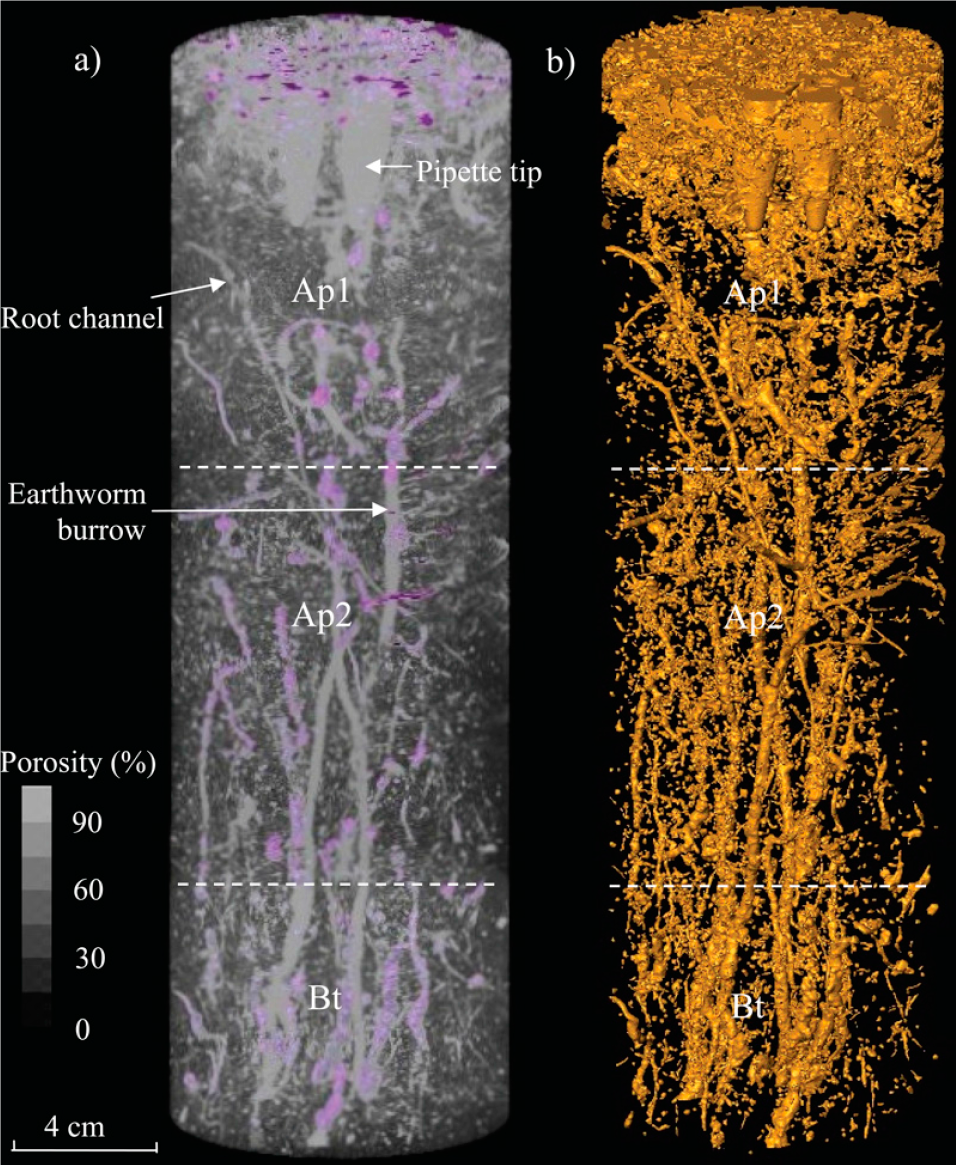
Hysteresis in the soil water retention curve has multiple possible causes including: air entrapment, contact angle hysteresis, and the “ink bottle” effect. Air-entrapment occurs when a partially-drained soil is rewetted and small pockets of air become trapped in the interior pore spaces. This entrapped air cannot easily be removed, even if the soil is submerged underwater. As a result, higher water contents occur along the primary drainage curve from a fully saturated condition than those that occur during subsequent re-wetting (e.g. Fig. 3‑8). Due to air-entrapment during re-wetting, the soil water content approaches a maximum value below the true saturated water content and this lower value is sometimes called the satiated water content. The image in Fig. 3‑9 was generated by X-ray computed tomography and shows air-entrapment in the complex macropore network of a satiated soil column [24]. Soil chemical, physical, and biological processes can alter the amount and distribution of entrapped air over time, so the impact of air-entrapment on soil water retention can change with each subsequent re-wetting cycle.
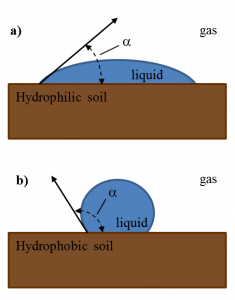
A second potential cause of hysteresis in the soil water retention curve is a phenomenon known as contact angle hysteresis. The contact angle is the angle at which a liquid-gas interface meets a solid surface (Fig. 3‑10). In our context, this means the angle at which the interface between the soil solution and the soil gas phase contacts the soil solids. Mineral soils often have contact angles <90° and are classified as hydrophilic, i.e. having affinity for water. Organic soils and mineral soils in which much of the surface area becomes covered with organic coatings can have contact angles >90°, making them hydrophobic, i.e. tending to repel water.
To visualize contact angle hysteresis and how it may affect soil water retention, a thought experiment may help. Imagine if we added a sufficiently small volume of liquid to the drop in Fig. 3‑10a, the edge of the drop would not move but the contact angle would increase slightly. Likewise if we removed a sufficiently small amount of liquid, the contact angle would decrease slightly. Thus, contact angles for wetting and drying processes are different, i.e. contact angles exhibit hysteresis. The larger contact angles during wetting versus drying lead to higher (less negative) pressure potentials for the same water contents, consistent with Fig. 3‑8.
A third potential cause for hysteresis is the ink bottle effect, which refers to the way in which drainage from a relatively large cavity, such as the body of an old-fashioned ink bottle, can be restricted if the fluid must drain through a relatively narrow opening, such as the neck of an inverted ink bottle. The analogy is somewhat helpful, but to better understand how this phenomenon influences soil water retention, we need to understand an important related phenomenon called capillary rise. Capillary rise is the rise of liquid against the force of gravity due to the upward force produced by the attraction of the liquid molecules to a solid surface and to each other.
When you insert a small diameter tube, or capillary, into a fluid, such as water, the surface of the fluid inside the capillary may rise above that of the surrounding fluid, and the height (h) of this capillary rise is described by:
![\[ h=\frac{2 \gamma cos \alpha }{ \rho gr} \]](https://open.library.okstate.edu/app/uploads/quicklatex/quicklatex.com-f802be8ba7f8e2b68fa458591b406759_l3.png "Rendered by QuickLaTeX.com")
(Eq. 3-2)
where γ is the surface tension of the fluid (N m-1), α is the contact angle of the liquid-gas interface on the wall of the tube, ρ is the fluid density (kg m-3), g is the acceleration due to gravity (m s-2), and r is the radius of the capillary (m). Thus, the smaller the radius of the capillary, the greater the height of the capillary rise. To better understand this equation, watch this video. The pressure potential just below the capillary meniscus is simply the negative of the capillary rise.
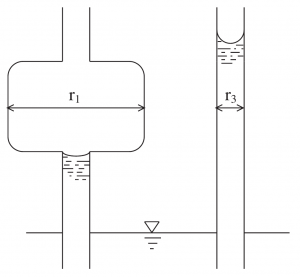
In Fig. 3‑11, two capillary tubes have been inserted into water. The height of the resulting capillary rise was greater for the uniformly narrow tube on the right than for the non-uniform tube on the left. During this filling or wetting phase, capillary rise could only raise water to the bottom of the tube section with the enlarged diameter. If instead both tubes had drained from an initially water filled condition, then the enlarged section would have remained water-filled and height of water in both tubes would have been equal. Thus, for capillary tubes or soil pores with non-uniform radii, that non-uniformity can cause hysteresis in the water retention curve [25].
3.3.4 Measuring Soil Water Retention Curves
Because of the complexity of soil pore networks, we are currently unable to theoretically predict soil water retention curves from first principles, although progress has been made and is being made toward that goal [26, 27]. Until that goal is achieved, we will continue to determine soil water retention curves primarily by empirical methods, i.e. methods based on measurements and experience rather than theory or logical reasoning. Measurements of soil water retention are typically, but not always, performed in the laboratory with different methods being suitable for different portions of the possible range in soil matric potential. Near saturation, intact soil samples should be used because the soil structure and inter-aggregate pores can strongly influence water retention. At matric potentials below approximately –15 kPa, the effects of soil structure on water retention appear to be negligible [28] and smaller homogenized soil samples are typically used.
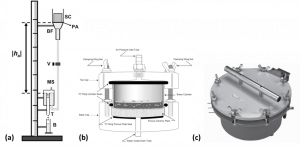
For matric potentials between 0 kPa and approximately -10 kPa, a simple hanging water column or tension table is often used to precisely control a sample’s matric potential (Fig. 3‑12a). When the sample reaches equilibrium with the imposed matric potential, i.e. when water stops flowing, the water content of the sample can be determined by the change in the mass of the sample. For matric potentials between -10 and -100 kPa, small pressurized chambers often called Tempe cells work well, particularly for intact soil samples (Fig. 3‑12b). A special porous ceramic plate at the bottom of the chamber, when saturated, allows water, but not air, to flow out of the chamber. The air pressure is increased to the absolute value of the desired matric potential, and once equilibrium is reached, the water content of the sample is determined based on the volume of water which flowed out of the sample or the change in mass of the sample. For matric potentials between -100 and -1500 kPa, specialized pressure plates in larger chambers have often been used (Fig. 3‑12c). The principle of operation is similar to that of Tempe cells, but smaller samples of homogenized soil are used with each chamber housing multiple samples, and sometimes even multiple pressure plates. At these low matric potentials, true equilibrium may take many weeks or may never be reached, and a growing body of research suggests that data from pressure plate measurements may be unreliable at matric potentials below -100 kPa [29-31]. Dewpoint potentiometers (Fig. 3‑5) offer one alternative measurement approach in this matric potential range.
3.3.5 Mathematical Functions for Soil Water Retention
Once we have measured soil water retention at several values of matric potential, we often need to fit a mathematical function to the measurements to allow calculation of water content for all other possible values of matric potential. One of the earliest widely-used water retention functions, developed by Brooks and Corey [32], is defined by:
![\[ \frac{\Theta-\Theta_r}{\Theta_s-\Theta_r}=(\frac{\Psi_c}{\Psi_m})^2 for \Psi_m<\Psi_c \]](https://open.library.okstate.edu/app/uploads/quicklatex/quicklatex.com-ee0d3afe52f99f02930acb6d884bdda9_l3.png "Rendered by QuickLaTeX.com")
(Eq. 3-3)
where θr is the residual water content, which is conceptually the water content below which liquid water flow in the soil is no longer possible, ψe is the air-entry potential, and λ is a number related to the pore size distribution of the soil. Larger values of l indicate more uniformly-sized pores, while small values indicate a wide distribution of pore sizes are present.
A slightly simpler water retention function that is more convenient to use when performing calculations by hand was developed by Campbell [33] and is defined by:
![\[ \frac{\Theta}{\Theta}=(\frac{\Psi_e}{\Psi_m})^\frac{1}{b} for \Psi_m<\Psi_e \]](https://open.library.okstate.edu/app/uploads/quicklatex/quicklatex.com-0dd0076cdbc7353022e07537f3e6831b_l3.png "Rendered by QuickLaTeX.com")
(Eq. 3-4)
where again b is a parameter related to the pore size distribution. The Campbell water retention function does not include a residual water content.
A more flexible and more widely-used water retention function was developed later by van Genuchten [34]. That function is defined by:
![\[ \frac{\Theta-\Theta_r}{\Theta_s-\Theta_r}=\left[ 1+(-\alpha \Psi_m)^n\right]^{-m} \]](https://open.library.okstate.edu/app/uploads/quicklatex/quicklatex.com-435bebf4d427db9b7b910295c2c72448_l3.png "Rendered by QuickLaTeX.com")
(Eq. 3-5)
where α is a parameter that is inversely related to the air-entry potential, n is a pore size distribution index similar to λ, and m is a parameter often defined by m = 1 – 1/n.
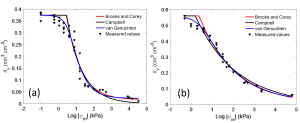
The most accurate way to estimate the parameters needed for these water retention functions is to obtain measurements of soil water retention across a broad range of matric potentials and then to adjust the parameters to achieve the best possible agreement with the measured values. Measured water retention curves for a loamy sand and a silt loam soil are shown in Fig. 3‑13 along with best-fits of the Brooks and Corey, Campbell, and van Genuchten water retention functions. All three functions fit the data reasonably, with the primary difference in this case being the sharp drop in water content at the air-entry potential predicted by the Brooks and Corey and the Campbell functions. The optimized parameters for each function are listed in Table 3‑1 along with the root mean square error (RMSE), which is a measure of the error in the water content values estimated using the fitted function. For these two soils, all three functions fit the measured data well, but the van Genuchten function has the lowest RMSE.
If you do not have measurements of soil water retention for a particular soil, you can get a general idea of the shape of the water retention curve simply by knowing the soil textural class. Table 3‑2 provides estimates of the parameters for the Brooks and Corey, van Genuchten, and Campbell water retention functions based on
Table 3‑1. Best fit parameters for the Brooks and Corey, Campbell, and van Genuchten water retention functions for samples of Tifton sandy loam and Waukegan silt loam. The root mean square error (RMSE) is also shown to indicate the quality of the fit.

soil textural class alone. This table is one simple type of pedotransfer function, a statistical tool for estimating unknown soil properties from known soil properties. The values in this table are suitable for educational purposes and general approximations of soil water retention behavior but not for many research or design purposes. For more reliable parameter estimates, you can use more complex and more accurate pedotransfer functions if you know additional soil properties such as percent sand, silt, and clay or bulk density or if you have one or more measurements of soil water retention available [35-37].
Table 3‑2. Average parameters for the Brooks and Corey, van Genuchten, and Campbell soil water retention functions by USDA soil textural class. The residual water content (qr), saturated water content (qs), α, and n values were based on Schaap et al. (2001), the air-entry potential (ψe) and λ values were taken from Rawls et al. (1982), and the b values were taken from Rawls et al. (1992). Variables followed by a * are the back-transformed log mean for the textural class.