7.2 Runoff and Erosion Models
Over the years, scientists and engineers have developed many models for predicting runoff and erosion, and these models range from relatively simple empirical models to highly complex mechanistic models. One of the most widely used empirical models for predicting runoff is the Curve Number Method, which was developed by the USDA Soil Conservation Service (now the Natural Resources Conservation Service, NRCS) in the 1950’s [5]. The curve number method is based on the idea of a ratio between the actual amount of precipitation retained by the landscape during a rainfall event, F, and the potential maximum retention amount for that landscape, S. The core hypothesis of the method is that this ratio (F/S) is equal to the ratio between the amount of runoff from the landscape, Q, and the total precipitation amount, P, reduced by some “initial abstraction”, Ia. Mathematically, we can write this as:
![]()
Now, the amount retained during the event, F, is equal to the total rainfall minus the initial abstraction minus the amount of runoff, i.e. F = P – Ia – Q. Substituting this expression for F in Eq. 7-1 and rearranging gives:
![]()
which is only valid for P > Ia. The initial abstraction is typically estimated as 20% of the potential maximum retention, i.e. Ia = 0.2S. The value of S is calculated based on an empirical curve number, CN, which is a number between 0 and 100 selected based on the hydrologic characteristics of the landscape.
![]()
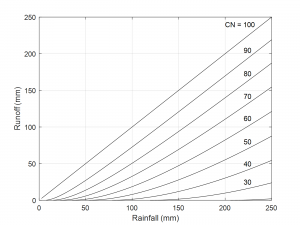
where S here is in inches. Unit conversion can be applied as needed, and the units of S, P, Ia, and Q must be the same. Curve numbers for a wide variety of circumstances are available here (link). The expected relationship between rainfall and runoff based on the curve number method is shown in Fig. 7‑7 for a range of CN values. Procedures exist for adjusting the CN values based on the initial soil moisture conditions, with lower values for drier conditions and higher values for wetter conditions. Research has indicated that setting the initial abstraction to 5%, rather than 20%, of S results in more accurate runoff predictions, but this change also requires revising the existing CN values [6].
In contrast to empirical methods like the Curve Number Method, mechanistic models have been developed, which predict runoff by simulating the underlying mechanisms of the soil water balance and the overland flow processes. These models typically require detailed information about weather and rainfall patterns, soil properties, topography, and land use. This information is used to simulate the dynamics of rainfall interception and infiltration, and from those, runoff is predicted. Many of these models include spatial information allowing simulation of overland flow processes as runoff from different portions of the landscape converges towards a stream. One widely used mechanistic model capable of predicting both runoff and the associated soil erosion is the USDA Water Erosion Prediction Project (WEPP) model.
The WEPP model development was led by the National Soil Erosion Research Laboratory of the USDA Agricultural Research Service. Over 200 people contributed to the development of the model, and the team conducted rainfall simulation experiments (Fig. 7‑8) at over 50 sites to generate data for developing and testing the model [7]. The model simulates infiltration using the Green-Ampt approach in a manner similar to that described in section 6.3. As we saw previously, the soil hydraulic conductivity is a key parameter in the Green-Ampt approach, and in the WEPP model the hydraulic conductivity is influenced by tillage, crusting, surface cover, and storm precipitation amount [8]. Runoff is predicted based on the surface water excess. Despite its complexity, the WEPP model can be setup and run relatively easily using the online versions of the model (link).