
6.2 Green-Ampt Infiltration Model
In the early 1900s, Heber Green and G.A. Ampt were studying drainage and soil water flow in Australia. They built their efforts on the early soil physics literature, including the seminal contribution of Edgar Buckingham on flow in unsaturated soil, as described in section 4.7. In 1911, they published physically-based equations describing downward infiltration, upward infiltration (as from a water table), and horizontal infiltration (as from a channel or ditch) [5]. For the case of downward infiltration, the flow situation envisioned by Green and Ampt is represented in Fig. 6‑2. Their approach resulted in a simplistic but elegant approximation for infiltration when water is ponded on the soil surface.
The Green-Ampt model for downward infiltration can be written as:
![\[ i=K\frac{ (L_f+H_0-H_f )}{L_f} \]](https://open.library.okstate.edu/app/uploads/quicklatex/quicklatex.com-bda7306442c85e5006669fe9d1df5281_l3.png "Rendered by QuickLaTeX.com")
(Eq. 6.2)
where i is the infiltration rate, K is the hydraulic conductivity of the soil, Lf is the distance (or length) from the soil surface to the wetting front, H0 is the pressure head at the soil surface, and Hf is the pressure head at the wetting front. This model is based on the following assumptions:
- homogeneous soil with a uniform initial water content, θi
- the pressure head at the wetting front, Hf, is constant
- the water content and hydraulic conductivity, K, are uniform and constant in the wetted region
- the ponding depth, H0, is constant
This model works best when a relatively sharp or distinct wetting front exists throughout the infiltration process. Such a distinct wetting front is more likely to occur in coarse-textured soils than in fine-textured soils and in initially dry soil than in initially wet soil. The model also works best when the soil texture is homogeneous throughout the wetted region and when air-entrapment, surface crusting, and soil swelling do not substantially influence the infiltration process.
The Green-Ampt model also provides a way to estimate cumulative infiltration during an infiltration event. The relevant equation is
![\[ I=L_f \cdotp \Delta\Theta \]](https://open.library.okstate.edu/app/uploads/quicklatex/quicklatex.com-62b72d3c62d8e1a212b1625bb32d7da9_l3.png "Rendered by QuickLaTeX.com")
(Eq. 6-3)
where I is the cumulative infiltration and Δθ is the difference between the final water content, θf, and the initial water content, θi. One difficulty in applying this equation is that there is not a direct (i.e. explicit) way to calculate how the position of the wetting front, Lf, changes over time, t. For that purpose, we have to solve the following equation for Lf by trial-and-error (i.e. implicitly):
![\[ \frac{K \cdotp t}{\Delta\Theta}=L_f-(H_o-H_f)1n \left(1+\frac{L_f}{H_o-H_f} \right) \]](https://open.library.okstate.edu/app/uploads/quicklatex/quicklatex.com-5e16972486d4e3334ebdbe8060718dee_l3.png "Rendered by QuickLaTeX.com")
(Eq. 6-4)
Despite its assumptions and caveats, the Green-Ampt model has proven to be extremely useful for helping us understand and predict infiltration. The power of this model lies in the fact that it succinctly describes the most fundamental reason why infiltration rates tend to decrease over time—the hydraulic gradient driving infiltration tends to decrease over time. The Green-Ampt model can be viewed as a specialized application of the Buckingham-Darcy law (Eq. 4-5) as explained in this video (link). The ratio on the right hand side of the Green-Ampt equation represents the hydraulic gradient. Since the ponding depth, H0, and the pressure potential at the wetting front, Hf, are treated as constants, the hydraulic gradient gets smaller as Lf gets larger, i.e. as the wetting front moves farther away from the soil surface.
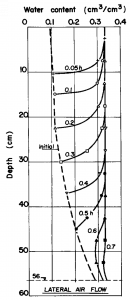
The main features of the infiltration process as represented by the Green-Ampt model are evident in experimental results, such as those shown in Fig. 6‑3. These data from a laboratory experiment using a soil column filled with fine sand clearly show how the rate of advance of the wetting front, and thus the infiltration rate, decreases over time [6]. The wetting front reached the 10 cm depth in only about 0.05 h (3 minutes), but it took about four times as long (0.2 h or 12 minutes) to reach the 20 cm depth. Thus, these data also emphasize a fundamental tendency of infiltration—during the early part of an infiltration event, the wetting front position is approximately proportional to the square root of the event duration. Cumulative infiltration follows this same proportionality, and the Green-Ampt model captures this behavior.
