4.1 Pores and Pore Networks
Closely associated with the spatial patterns of the soil solid phase are the complementary spatial patterns of the soil pore network. The soil pores provide vital flow paths for water, oxygen, carbon dioxide, and nutrients without which life in the soil would be impossible. They also provide habitat for a host of living organisms in the soil. Soil scientists have long known that the soil pore networks are incredibly complex with different degrees of connectivity between pores giving rise to tortuous flow paths and with pore sizes varying by orders of magnitude even within the same soil. So before we can understand water flow in soil, we will need to understand soil pores and pore networks.
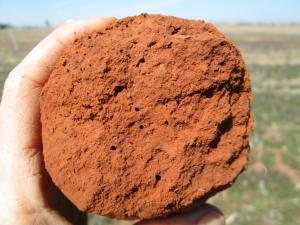
The largest soil pores are called macropores, and they are frequently major contributors to water flow and solute transport in soils (Fig. 4‑1). The minimum size criteria for soil macropores is somewhat subjective, but with respect to water flow and transport of solutes, the available empirical evidence suggests macropores are those with equivalent diameters greater than approximately 0.3 mm [1]. Macropores can be created by organisms including soil-dwelling animals, plant roots, and human tillage practices, as well as through physical processes such as soil shrinkage (resulting in cracks) and internal erosion (resulting in natural soil pipes) [2].
Biologically, macropores are often “hot-spots” where plant roots grow preferentially and soil organisms move more easily than in the bulk soil. As a result, macropore walls can be enriched in organic matter and clay content relative to the surrounding soil matrix (recall Fig. 2‑16), and this enrichment in turn affects chemical and biological processes. For example, soil from macropore walls has shown greater sorption and more rapid mineralization of organic contaminants, greater sorption of trace metals, greater microbial activity, and more rapid N cycling [1].
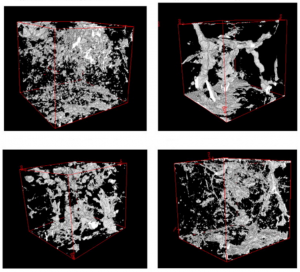
It is not only the size but also the organization of the pores into pore networks which influences soil water flow. For example, large dead-end pores may contribute little to water movement relative to smaller pores which provide a continuous flow path. Our ability to “see through” intact soil to visualize 3-D pore networks is in its infancy, but researchers using technologies from the field of medicine, such as X-ray computed tomography, are now able to provide intriguing images of pore networks that are changing our understanding of soil-water interactions. These images, like the ones in Fig. 4‑2, reveal networks that can differ dramatically in their shape and connectivity and challenge our current mental and mathematical models of soil water flow and storage.
Leonardo Da Vinci has been quoted as saying, “We know more about the movement of celestial bodies than about the soil underfoot,” and that is probably true with regards to our knowledge of macropores’ effects on soil water flow. Our fundamental concepts and theories for soil water storage and flow were mostly developed in the first half of the 20th century by engineers and physicists, often working in a laboratory with homogenized soil, sand, or even glass beads, instead of intact soil in the field. Thus, the soil water fundamentals that were discovered then, and still form the core of our knowledge, largely ignore the existence and effects of macropores on soil water processes. One of the current grand challenges for soil physicists and hydrologists is to develop new, unifying concepts and quantitative models that effectively incorporate the now substantial body of information on soil macropores and their effects on water flow [3]. As we move now to consider established concepts of soil water flow that are fundamental to soil physics and hydrology, we need to keep in mind this grand challenge and the limitations of our existing concepts.