11.5 Soil Water Availability Indicators
The specific soil water content at which the relative transpiration rate begins to decline depends, not only on the evaporative demand (and on the plant species), but also on the soil water retention characteristics. Therefore, when considering transpiration and plant water use, we often adjust or normalize the soil water content values to account for some of the soil specific differences. One common adjustment is to compute the plant available water (PAW), which is the equivalent depth of water which is available for plant uptake within a layer of soil of specified thickness. The value of PAW for a soil layer is:
![\[ PAW=(\Theta - \Theta_w_p) \cdotp L \]](https://open.library.okstate.edu/app/uploads/quicklatex/quicklatex.com-5ad6b446557490e0f52b8a847f226909_l3.png "Rendered by QuickLaTeX.com")
(Eq. 11-1)
where θ is the current value of soil volumetric water content, θwp is the soil volumetric water content at the permanent wilting point, and L is the thickness of the soil layer. Plant available water has length units, e.g. mm, the same as precipitation, which makes PAW values relatively easy to understand. Because PAW accounts for the soil-specific permanent wilting point, it provides a better indicator of water status across different soil types than does volumetric water content.
The capacity of a specific soil to store plant available water, i.e. the available water capacity (AWC), is often approximated by:
![\[ AWC=(\Theta_f_c-\Theta_w_p)\cdotp L \]](https://open.library.okstate.edu/app/uploads/quicklatex/quicklatex.com-62f67e308c0fbab42beb1cf16f2b5c38_l3.png "Rendered by QuickLaTeX.com")
(Eq. 11-2)
where θfc is the volumetric water content corresponding to “field capacity”. Despite the previously discussed shortcomings of the field capacity concept, AWC has proven to be a practical indicator of differences between soils in their capacity to store water for plant uptake. We can combine the prior two equations to determine the fraction of available water capacity (FAW) which is filled for at any particular value of soil water content:
![\[FAW=\frac{\Theta-\Theta_w_p}{\Theta_f_c-\Theta_w_p}\]](https://open.library.okstate.edu/app/uploads/quicklatex/quicklatex.com-ee150c091646c992989f11fa67b25fbc_l3.png "Rendered by QuickLaTeX.com")
(Eq. 11-3)
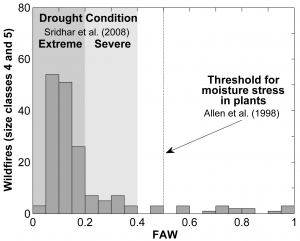
Although there is substantial variability in the value of FAW below which plant water stress occurs, we can often use FAW = 0.5 as an approximate threshold for plant water stress. Effective procedures for modeling plant water use and adjusting water stress thresholds for specific situations are available [3].
If we have soil volumetric water content measurements, and estimates of the soil water retention properties, then we can use the FAW concept to estimate or monitor the degree of plant water stress. For example, FAW has proven to be a good indicator of the probability of large wildfires during the growing season in Oklahoma [4]. These large growing season fires only occur if the vegetation is under water stress severe enough to reduce the vegetation water content to levels low enough that the vegetation will readily burn. The vast majority of large growing-season fires in Oklahoma occur when FAW drops below 0.2, indicating severe water stress.