Analytics – The Backbone of Your Social Media Strategy
Cheryl Lawson
Beyond Likes and Shares: Analytics as a Strategic Compass
In today’s digital age, analytics isn’t just about counting likes or followers—it’s about turning raw data into actionable insights that drive decisions. The adage “If it can’t be measured, it can’t be managed” is only half true. The real power lies in how you measure, interpret, and act on the data. Social media analytics tools, when used strategically, can reveal patterns, predict trends, and connect online engagement to real-world outcomes like sales, loyalty, and brand advocacy.
The Tools of the Trade: From Native Insights to Advanced Dashboards
1. Platform-Specific Analytics
Every major platform offers built-in analytics (e.g., Instagram Insights, TikTok Analytics, Facebook Insights). These tools are ideal for:
- Quick checks: Instant metrics like post engagement, reach, or follower demographics.
- Content optimization: Identifying top-performing posts or optimal posting times.
But they lack cross-platform context and deeper integration with business goals.
2. Third-Party Tools for Advanced Strategy

For brands serious about ROI, third-party tools aggregate data, streamline reporting, and tie social performance to business outcomes. My personal favorite:
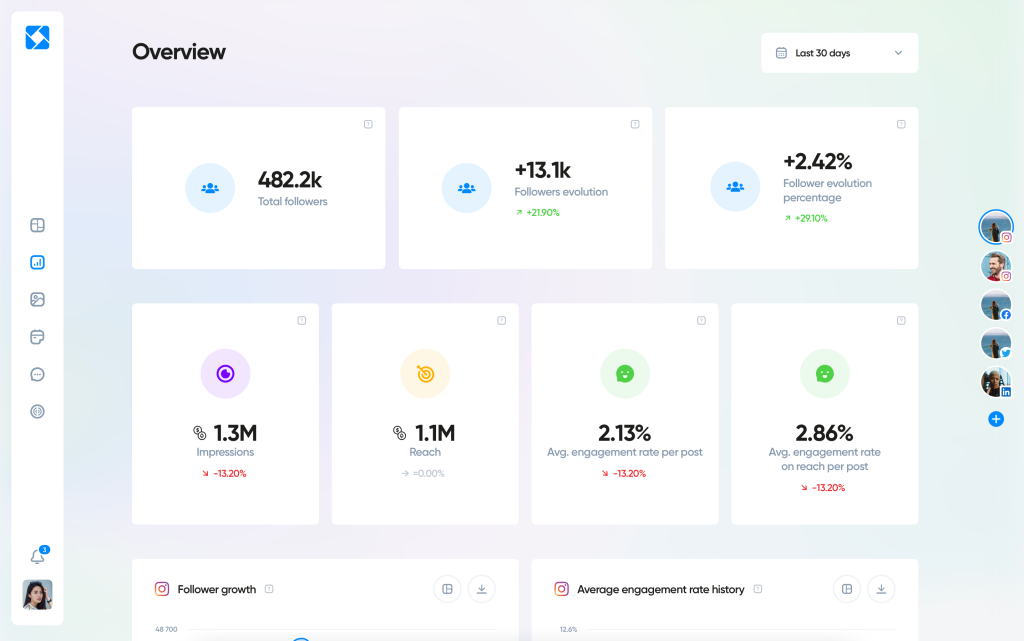
- Iconosquare
- Dashboard Power: Track performance across Instagram, Facebook, Twitter, and TikTok in one place.
- Deep Insights: Identify your most engaging posts (by format, hashtag, or time), analyze audience growth trends, and benchmark against competitors.
- Conversion Tracking: If your social media tracking is enabled, monitor website clicks, lead generation, and even sales attribution (e.g., “Did that viral Reel drive purchases?”).
- Reporting Made Easy: Export polished, client-ready reports with customizable graphs and visuals.
Other tools like Sprout Social, Hootsuite, and HubSpot offer similar cross-platform analytics but differ in niche features (e.g., HubSpot’s CRM integration for tracking leads from social to sale).
Metrics That Matter: Aligning Data with Business Goals
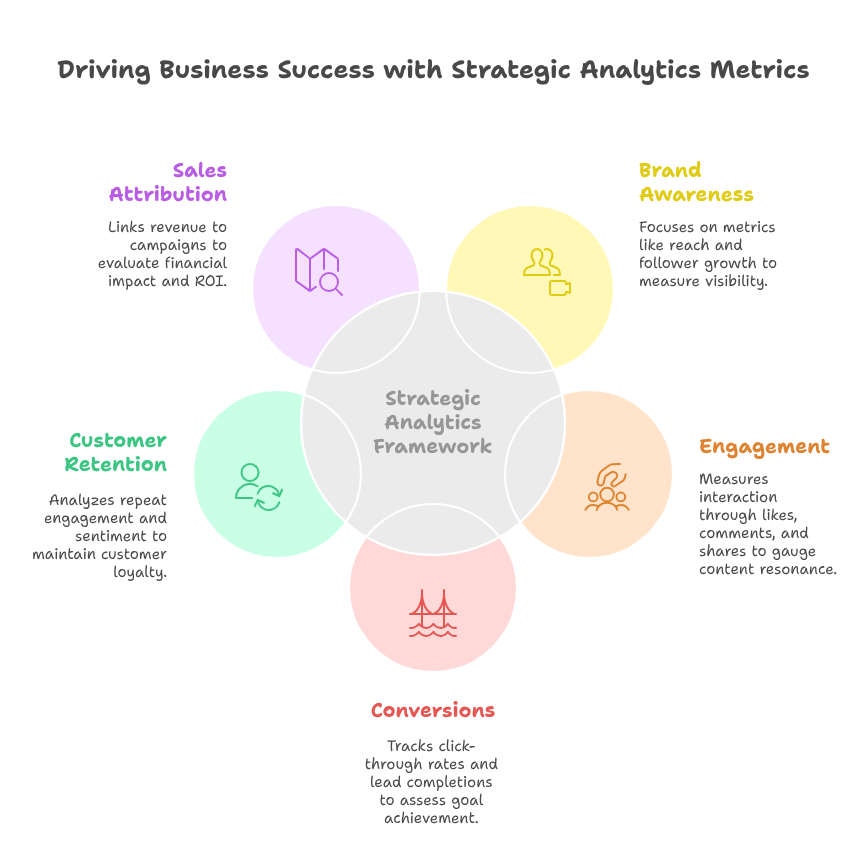
Forget vanity metrics. Focus on KPIs tied to your objectives:

Pro Tip: Use UTM parameters to track how social campaigns drive website behavior. For example, a link in your bio tagged with ?utm_source=instagram&utm_campaign=spring_sale reveals exactly which platform and campaign generated clicks.
Case Study: From Data to Dollars
Scenario: A boutique clothing brand uses Iconosquare to analyze its Instagram performance. They discover:
- Top Content: Carousel posts showcasing “outfit ideas” generate 3x more saves and shares than product-only posts.
- Audience Insight: 65% of their followers are active between 7–9 PM.
- Conversion Gap: High engagement but low website clicks.
Action:
- Shift posting schedule to 7 PM.
- Create more “outfit idea” carousels with clear CTAs (“Shop the Look”).
- Use UTM-tagged links to track traffic.
Result: Website visits from Instagram increased by 40%, with a 15% rise in sales attributed to social campaigns.
Avoiding Common Pitfalls
- Vanity Metrics Trap: Don’t celebrate follower growth if it doesn’t align with your target audience. 10,000 irrelevant followers are worth less than 1,000 loyal fans.
- Analysis Paralysis: Focus on 3–5 KPIs max. Too much data drowns strategy.
- Ignoring Sentiment: Metrics like comments and DMs reveal how people feel, not just how many engaged.
Your Analytics Action Plan
- Audit Your Tools: Use platform-native analytics for daily checks and a third-party tool (like Iconosquare) for cross-platform strategy.
- Set SMART Goals: Specific, Measurable, Achievable, Relevant, Time-bound.
- Schedule Regular Reviews: Weekly for tactical adjustments, monthly for trend analysis.
- Iterate and Optimize: Kill underperforming content types and double down on what works.
Discussion Questions
- How would you use Iconosquare’s “Most Engaging Posts” report to refine a content calendar?
- Why might a viral post with high reach but low conversions still be valuable?
- How can sentiment analysis complement quantitative metrics like CTR or engagement rate?
Try This Now
- Log into Iconosquare (or a similar tool) and export your “Top Posts” report from the last 30 days.
- Identify one pattern (e.g., “Video posts perform best on Thursdays”).
- Adjust your next week’s content plan based on this insight.

