
6 Categorical Logic
I. Venn diagrams1
Pictures and diagrams can be very useful in presenting information or assisting reasoning. In this module we shall focus on Venn diagram. They are used to represent classes of objects. We can also use them to evaluate the validity of certain types of arguments.
Venn diagrams are named after the British logician John Venn (1834-1923), a fellow of Gonville and Caius college at Cambridge University. He was also a philosopher and mathematician, a pioneer of logic and probability theory.
II. Basic Notation
1. A class is defined by its members
Let us start with the concept of a class. A class or a set is simply a collection of objects. These objects are called members of the set. A class is defined by its members. So for example, we might define a class C as the class of black hats. In that case, every black hat in the world is a member of C, and anything that is not a black hat is not a member of C. If something is not a member of a class, we can also say that the object is outside the class.
Note that a class can be empty. The class of men over 5 meters tall is presumably empty since nobody is that tall. The class of plane figures that are both round and square is also empty since nothing can be both round and square. A class can also be infinite, containing an infinite number of objects. The class of even number is an example. It has infinitely many members, including 2, 4, 6, 8, and so on.

2. Classes are represented by circles
- As you can see in the diagram above, the class of black hats, C, is represented by a circle. We normally use circles to represent classes in Venn diagrams, though sometimes we also use bounded regions with different shapes, such as ovals.
- We can write the name of the class, e.g. “C”, or “Class C”, next to the circle to indicate which class it is.
- The area inside the circle represents those things which are members of the class.
- The area outside the circle represents those things which are not members of the class, e.g. green hats, keys, cakes, etc.
- A Venn diagram is usually enclosed by a rectangular box that represents everything in the world.
3. Use shading to indicate an empty class
Let us now consider what shading means:
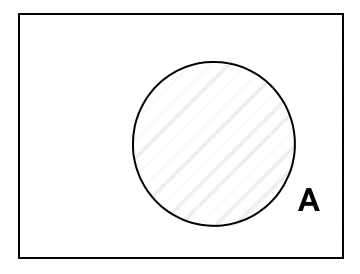
To indicate that a class is empty, we shade the circle representing that class. So the diagram above means that class A is empty.
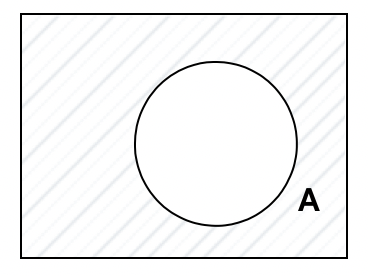
In general, shading an area means that the class represented by the area is empty. So the second diagram above represents a situation where there isn’t anything which is not a member of class A.
However, even though shading indicates emptiness, a region that is not shaded does not necessarily indicate a non-empty class. As we shall see in the next tutorial, we use a tick to indicate existence. So in the second diagram above, the circle marked A is not shaded. This does not imply that there are things which exist which are members of A. If the area is blank, this means that we do not have any information as to whether there is anything there.
III. Everything and nothing
1. Intersecting circles
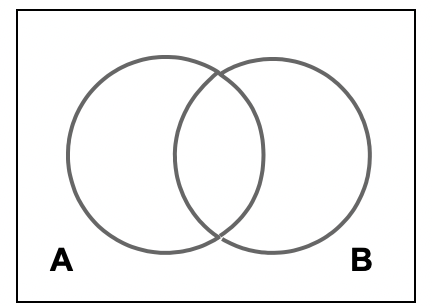
Now let us consider a slightly more complicated diagram where we have two intersecting circles. The left circle represents class A. The right one represents class B.
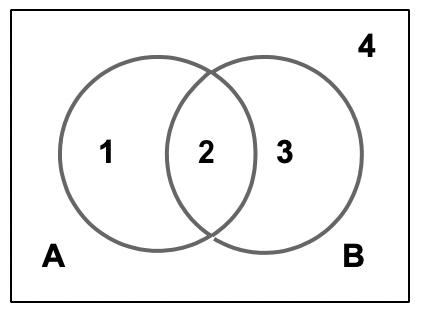
Let us label the different bounded regions:
- Region 1 represents objects which belong to class A but not to B.
- Region 2 represents objects which belong to both A and B.
- Region 3 represents objects which belong to B but not A.
- Region 4, the area outside the two circles, represents objects that belong to neither A nor B.
Exercise #1
So for example, suppose A is the class of apples, and B is the class of sweet things. In that case what does region 2 represent?
Exercise #2
Furthermore, which region represents the class that contains sour lemons that are not sweet?
2. Everything and nothing
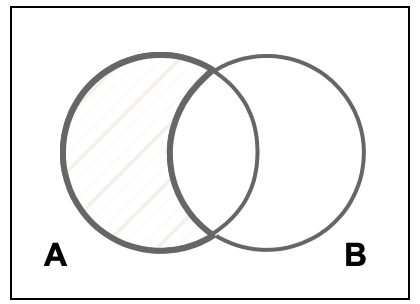
Continuing with our diagram, suppose we now shade region 1. This means that the class of things which belong to A but not B is empty. Or more simply, every A is a B. ( It might be useful to note that this is equivalent to saying that if anything is an A, it is also a B. ) This is an important point to remember. Whenever you want to represent “every A is B”, shade the area within the A circle that is outside the B circle.

What if we shade the middle region where A and B overlaps? This is the region representing things which are both A and B. So shading indicates that nothing is both A and B. If you think about it carefully, you will see that “Nothing is both A and B” says the same thing as “No A is a B” and “No B is an A”. Make sure that you understand why these claims are logically equivalent!
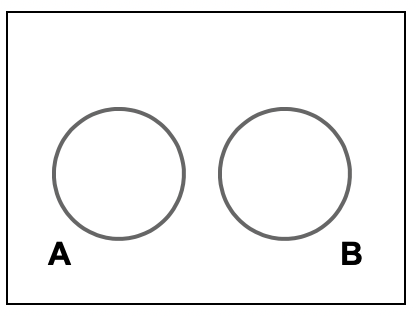
Incidentally, we could have represented the same information by using two non-overlapping circles instead.
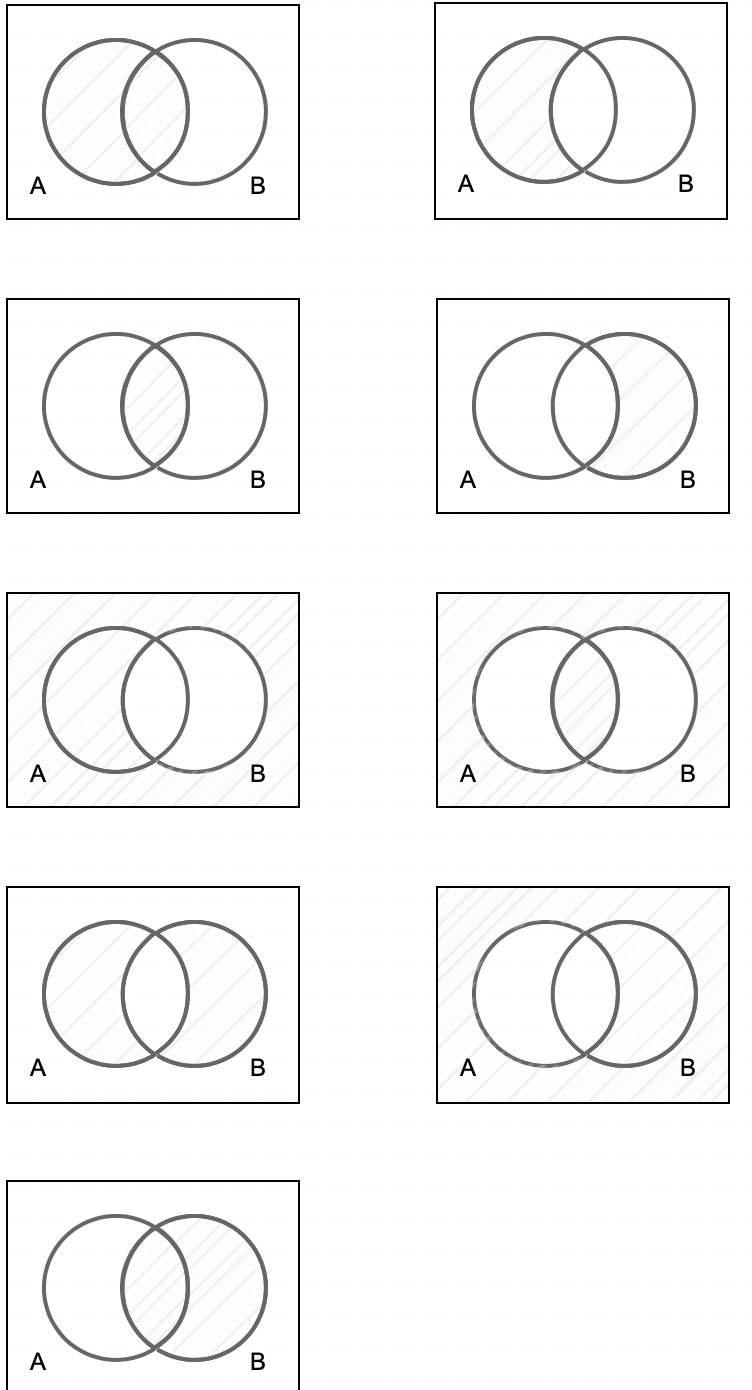
IV. Exercises
See if you can explain what each diagram represents.
V. Three circles
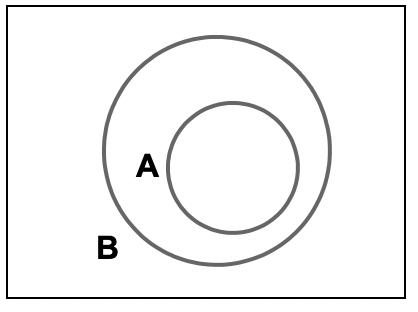
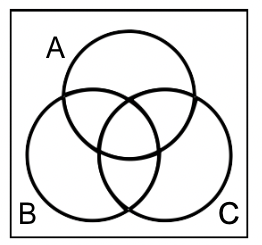
So far we have been looking at Venn diagrams with two circles. We now turn to Venn diagrams with three circles. The interpretation of these diagrams is the same as before, with each circle representing a class of objects, and the overlapping area between the circles representing the class of objects that belong to all the classes.
As you can see from the diagram below, with three circles we can have eight different regions, the eighth being the region outside the circles. The top circle represents the class of As, whereas the circles on the left and the right below it represent the class of Bs and Cs respectively. The area outside all the circles represents those objects which are not members of any of these three classes.

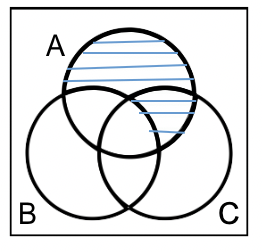
1. Shading
Now that you know what each of the region represents, you should know how to use shading to represent situations where “Every X is Y”, or “No X is Y”. As before, shading an area indicates that nothing exists in the class that is represented by the shaded region.
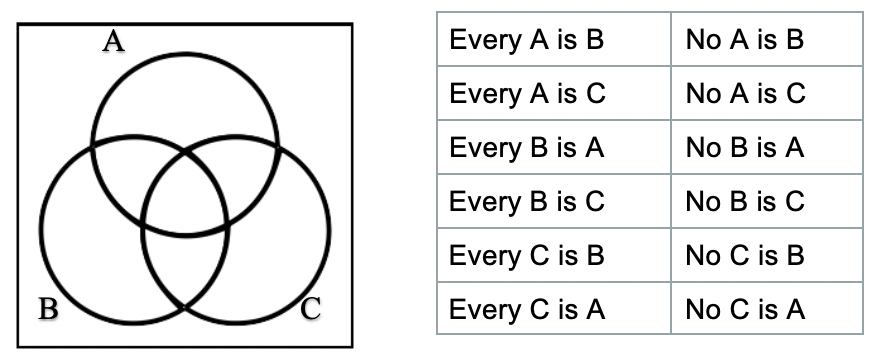
Exercise #1
Look at the sentences in the diagram below. Ask yourself which region should be shaded to represent the situation described by the sentence. Then click that sentence and check the answer.
VI. Existence
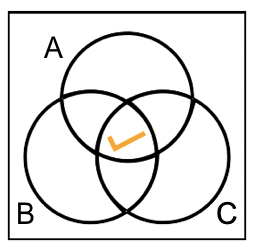
We have seen how to use shading to indicate that there is nothing in the class represented by the shaded region. We now see how to use ticks to indicate existence. The basic idea is that when a tick is present in a region, it indicates that there is something in the class represented by the region. So for example, in the diagram below, we have a tick outside the circles. Since the area outside the circle represents the class of things that are neither A, nor B, nor C, the diagram is saying that something exists that is neither A nor B nor C:
There are two important points to remember :
- A tick in a region says that there is something in the class represented by the region. It does not say how many things there are in that class. There might be just one, or perhaps there are many.
- A region without a tick does not represent an empty class. Without a tick, a blank region provides no information as to whether anything exists in the class it represents. Only when a region is shaded can we say that it represents an empty class.
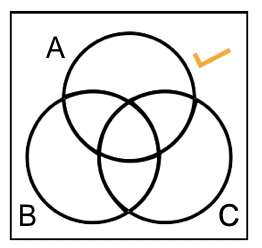
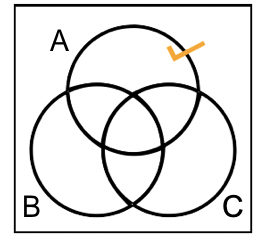
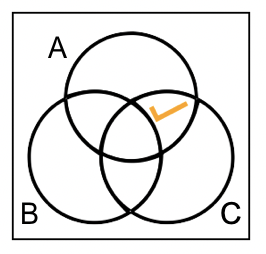
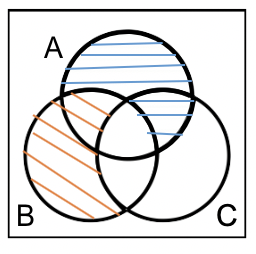
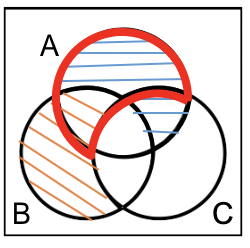
What about the following diagram? What does it represent?

The diagram above does NOT say “something is A”. Actually it says something more specific, namely that “something is A but is not B and not C”. If you have given the wrong answer, you might be thinking that the tick indicates that there is something in the class represented by the A circle. But here we use a tick to indicate existence in the class represented by the smallest bounded region that encloses the tick. In the top diagram of this page the smallest bounded area that encloses the tick is the area outside the three circles. In the diagram above, although circle A does enclose the tick, it is not the smallest bounded area that does that. That smallest region is the colored one in this diagram :
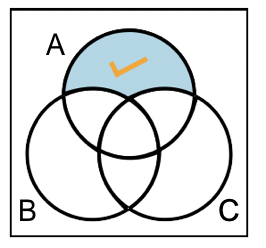
Now see if you can determine what these diagrams indicate.
Exercise #1
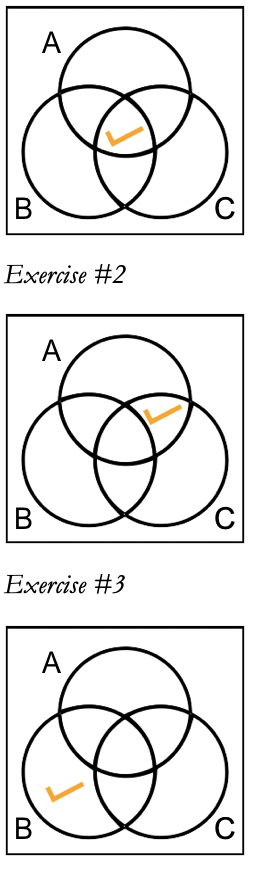

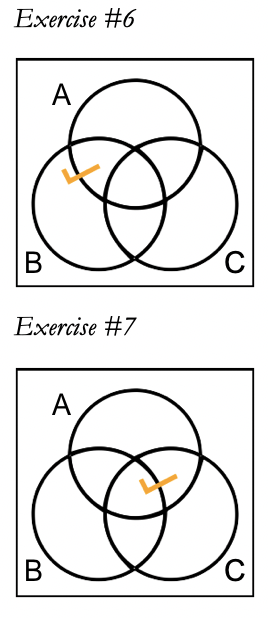
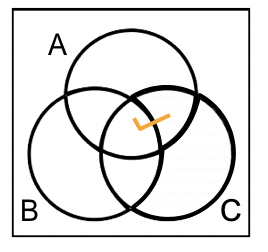
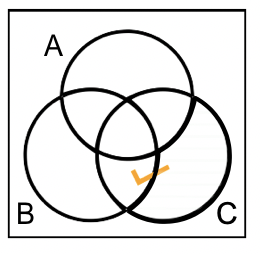
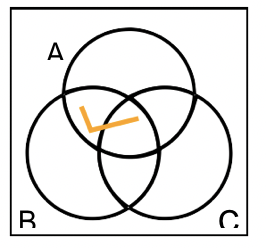
Notice in the last diagram above, the two ticks indicate that there are two different things. What if you just want to say “Something is C but not A”? The way to do this is to put a tick across two bounded regions, as follows:
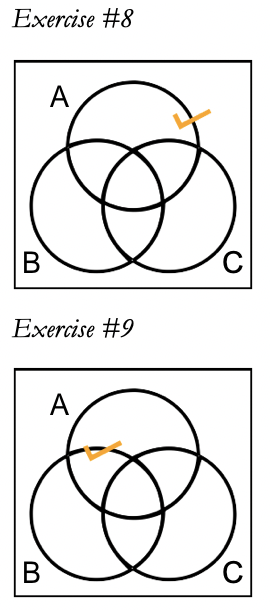
Exercise #5

The interpretation of this diagram employs the same rule as before. What the tick indicates is that there is something in the smallest closed region (the colored area) that encloses the tick. Of course, the bigger C circle also completely encloses the tick, but it is not the smallest bounded region that does that. So the tick does not mean that “something is C”.
Notice that the tick does not tell us whether there is anything that is B, because it is not completely enclosed by the B circle.
See if you can explain why these diagrams represent:
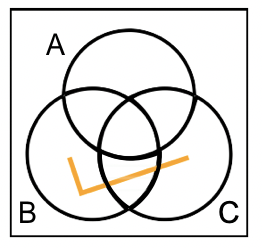
So far we have used ticks to cut across only two bounded regions. But of course there are other possibilities:
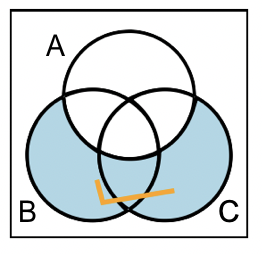
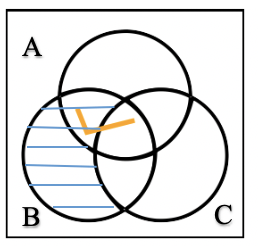
What do you think this means? Applying the same rule of interpretation as before, we see that the smallest closed region that encloses the big tick would have to be the combined three regions which the tick spreads across. This combined region represents things which are either B or C (or both), but which are not A. So what the diagram says is that there is something of this kind.
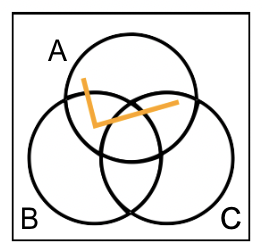
So what if we just want to represent the fact that something is A? Here is one way to draw the diagram: Notice that the tick cuts across all the different regions within the A circle, and is completely enclosed by it.
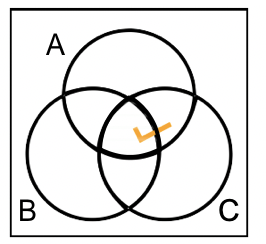
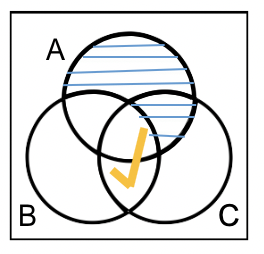
We can now combine what we have learnt about ticks and shading together. Suppose we start with the information that something is both A and C. We therefore draw the following diagram :
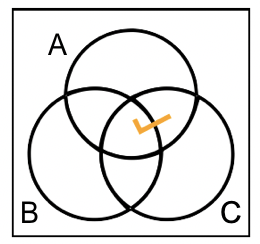
Now suppose we are also told that every C is a B. So we add the additional information by shading the appropriate area, and end up with this diagram :
How should this be interpreted and what should we conclude? Half of the green tick is in a shaded region. What does that mean? Give yourself a minute to think about it before you read on …
The answer is actually quite simple. The tick indicates that something is both A and C, and it occupies two separate regions. The left hand side region represents things that are A, B and C. The right hand side region represents things that are A and C but not B. Since the tick crosses these two regions, it indicates that there is something either in the class represented by the left region or in the class represented by the right region (or both of course). Shading tells us that there is nothing in the class represented by the right region. So whatever that exists according to the tick must be in the class represented by the left region. In other words, we can conclude that something is A, B, and C. In effect then, shading “moves” the tick into the left region since it tells us that there is nothing on the right. The above diagram is therefore equivalent to the following one :
So here is a general principle you should remember:
A truncated tick within a region R counts as a complete tick in R if part of the tick is in R and all other parts not in R are in shaded regions.
Exercise #1
Is the Statement “something is either B or C” true according to the diagram?
Exercise #2
Is the diagram consistent with the statement “Everything is B or not C, or both”?
Exercise #3
Is the diagram consistent with the statement “Something is B and not A”?
Exercise #4
Is the diagram consistent with the statement “Everything is A or C”?
Exercise #5
What does the diagram tell us?
VII. Syllogism
We now see how Venn diagrams can be used to evaluate certain arguments. There are many arguments that cannot be analysed using Venn diagrams. So we shall restrict our attention only to arguments with these properties:
- The argument has two premises and a conclusion.
- The argument mentions at most three classes of objects.
- The premises and the conclusion include only statements of the following form: Every X is Y, Some X is Y, No X is Y. Here are two examples :
(Premise #1) Every whale is a mammal.
(Premise #2) Every mammal is warm-blooded.
(Conclusion) Every whale is warm-blooded.
(Premise #1) Some fish is sick.
(Premise #2) No chicken is a fish.
(Conclusion) No chicken is sick.
These arguments are sometimes known as syllogisms. What we want to determine is whether they are valid. In other words, we want to find out whether the conclusions of these arguments follow logically from the premises. To evaluate validity, we want to check whether the conclusion is true in a diagram where the premises are true. Here is the procedure to follow:
Draw a Venn diagram with 3 circles.
Represent the information in the two premises.
Draw an appropriate outline for the conclusion. Fill in the blank in “If the conclusion is true according to the diagram, the outlined region should.”
See whether the condition that is written down is satisfied. If so, the argument is valid. Otherwise not.
1. Example #1
Let us apply this method to the first argument on this page :
Step 1 : We use the A circle to represent the class of whales, the B circle to represent the class of mammals, and the C circle to represent the class of warm-blooded animals.
Step 2a : We now represent the information in the first premise. (Every whale is a mammal.)
Step 2b : We now represent the information in the second premise. (Every mammal is warm-blooded.)
Step 3 : We now draw an outline for the area that should be shaded to represent the conclusion. (Every whale is warm-blooded.) This is the red outlined region. We write: “If the conclusion is true according to the diagram, the outlined region should be shaded.”
Step 4 : Since this is indeed the case, this means that whenever the premises are true, the conclusion must also be true. So the argument is valid.
2. Example #2
Let’s go through another example:
Every A is B.
Some B is C.
Therefore, some A is C.
We now draw a Venn diagram to represent the two premises:
In the diagram above, we have already drawn a Venn diagram for the three classes and encode the information in the first two premises. To carry out the third step, we need to draw an outline for the conclusion. Do you know where the outline should be drawn?
3. Example #3
Some A is B.
Every B is C.
Therefore, some A is C.
Step 1: Representing the first premise.
Step 2: Representing the second premise.
Step 3: Add an outline for conclusion
VIII. Limitations of Venn diagrams
Although Venn diagrams can help us reason about classes of objects, they also have many limitations. First of all, the diagrams can become too complicated to deal with if we are reasoning about many classes of objects. So far in our tutorials we have considered Venn diagrams with at most three circles. It is possible to add more bounded regions if we are dealing with more than three classes, but then the resulting diagrams will become rather difficult to handle and interpret. It is very easy to make mistakes when we encode information in such diagrams.
The other problem with Venn diagrams is that they have limited expressive power. What this means is that there are many pieces of information that cannot be accurately represented. For example, our system of notation allows us to talk about classes of objects, but not particular individual objects. For example, to say that a and b are cats and c and d are not, we might have to introduce new symbols, using dots to represent individuals, as in the diagram below:
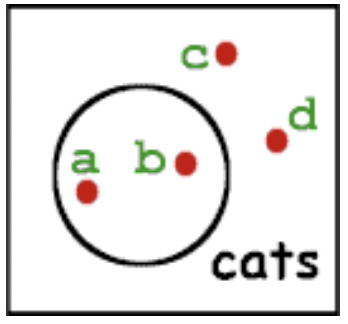
However, even with this new notation, there are still other pieces of information that cannot be represented, such as:
- Either Felix is a cat or it is a dog.
- If Peter is taller than Mary then Peter is older than Mary.
Perhaps it might be possible to introduce additional new symbols to represent such ideas. But then the system of Venn diagrams will get really complicated and difficult to use. So now that we know the limitations of Venn diagrams, we should be in a better position to know when they are useful and when they are not.
Exercise #1
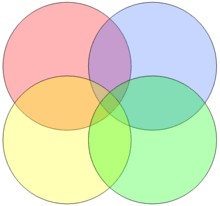
Is this a suitable Venn diagram for showing the relationships between four sets of objects?
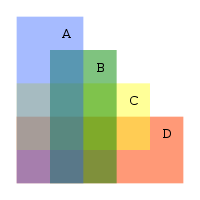
In the second diagram, there are four overlapping rectangles. Which area corresponds to those items which are A, B and D, but not C?
