
Chapter 5: Document Design
Katrina Peterson
Chapter Synopsis
This chapter briefly summarizes fundamental concepts to consider as you craft print and electronic texts. In this chapter you will read about basic principles of document design that allow writers to combine graphic elements with text to convey a message to audiences. Beginning with a discussion of standard conventions (of formatting, language, and style), the chapter then shares some basic guidelines for document design, moving forward to focus on integration of graphics, callouts and captions. Other topics include tables of contents, figures and tables, headings and the well-known CRAP test used by graphic designers. For additional resources, see the activities included at the chapter’s end.
5.1 Introduction
A text’s visual appeal matters to the reader, so it should also matter to the writer. Letters, reports, and blogs are more than just words on a page or screen. How ideas are arranged and delivered, whether electronically or on paper, can make reading seem intimidating, confusing, or downright unfriendly, even if the content itself is perfect. Conversely, a document’s design can draw in readers and engage them with your ideas. Think of the text as a room for your thoughts. Sometimes you want readers to get in and get out quickly, but often you want them to sit down and make themselves comfortable, put their feet up and stay a while. Regardless of your specific goal, it is important to make deliberate decisions about the design elements that affect audience experience.
As readers, we may seem a bit like TV viewers with remote controls. In a moment, attention may be diverted to another channel if something about the content distracts us. For this reason, a writer must consider carefully how to capture readers’ attention and hold it. Good content is a key part of this, of course, but the visual presentation of the content matters too. Reading is a difficult, cognitively demanding task, so if your design helps make readers’ journey through the text easier, you will hold their attention longer. Give your audience reasons to linger, and they will.
You already engage in document design practices. For instance, when formatting an academic essay, you center your title and separate the content into paragraphs, which signals to the reader that it is time for a breather, the content is shifting slightly, or you are introducing a new topic. You illustrate blogs, Web pages, and PowerPoint slides with photos and graphics, animations, or videos. Even small elements of your writing help guide readers: indentation, changes in type style (bold, italics, underline), or punctuation at the end of a sentence. Professional writers, especially those who work for well-funded web sites and mass-market print publications, are fortunate enough to have the services of artists, graphic designers, skilled photographers, and layout experts. But most of us just want to have a cooler-looking blog, a more professional-looking report, or an eBay listing that reinforces our credibility.
In many respects, document design is both a science and an art. The layout of documents—their content, color scheme, alignment, etc.—is the result of individual choices. It takes a long time to master the finer points of design. As a starting point, this chapter will offer some strategies for making your documents intuitive and audience friendly: easy to scan, search, and read. The goal of this chapter is to familiarize you with a few basic ways of thinking that designers know well. Whether you are typing up a memo on safety policies at work, producing a newsletter for your community, or putting together a booklet describing a new app, the following elements of document design are meant for you.
5.2 Standard Conventions
Appropriate format, language, and style are the basic design elements of all technical documents. A format with a structure that leads readers thorough the text and shows the hierarchical relationships among ideas—from most important to least important—is crucial. Readers should be able to identify the organizational pattern very quickly when scanning a technical document. The document should be reader friendly, or reader-centered rather than writer-centered. Using appropriate language provides readers with a thorough understanding of the document’s purpose, how it relates to the individual needs, and any actions readers will need to take. Although it is helpful to examine each element of a document individually, it is also wise to step back and consider the interrelation of elements, or how all components work together to communicate a message to a specific audience. In this sense, everything from language and style to a text’s visual aspects may either contribute to or detract from its overall design.
As discussed previously in the chapter on audience (see Chapter 2), a document may have one primary reader, several secondary readers, or a combination of both. A primary reader is the person who ordered the report to be written or the person for whom a report is intended. This reader will usually read the entire report. Secondary readers are those who will read only the sections of the report that relate to them, their jobs, their departments, responsibilities, etc. For example, in the case of a report that details funding for different departments, a superintendent may only want to read the section that relates to piping. This is where format, a table of contents, page numbers, the use of headings, etc. is significant in allowing easy access to information. It saves time when the piping superintendent can scan through the document and clearly find the heading that identifies his department.
Similar to formatting and language, there are also specific style conventions, or expectations, associated with different genres of writing. Academic papers, cover letters, résumés, business plans, and other documents tend to follow these conventions—some explicit (stated directly) and some implicit (unstated or indirectly stated). For example, Modern Language Association (MLA) and American Psychological Association (APA) styles dictate exactly what academic papers should look like. Associated Press (AP) style shapes the look of newspaper text, and Institute for Electrical and Electronics Engineers (IEEE) style governs engineering documents.
For every context in which you write, you will discover that field-specific style guides influence the appearance of a text, the way language is used, the preferred terminology and vocabulary, and the way sources are cited. Business- and commerce-established firms like Panasonic, IKEA, eBay, Sears, and Trader Joe’s have a style too. To preserve their brand identity, firms create recognizable, memorable logos and make sure their documents follow a certain agreed-upon style. Government and civic organizations also have logos and letterhead; even government and military documents are influenced by specific style conventions.
These style conventions matter. For each document design, you will need to know which set of conventions applies to it. For example, a cover letter should generally follow traditional business letter format. Memos and emails will look slightly different; we do not expect to see an address block for the letter recipient on an email because a street address is not needed to reply. Within your program of study and individual classes, the program or the professor will determine style, citation, and formatting conventions like MLA or APA. Style and formatting guides recommended by the World Wide Web Consortium (W3C) still help you when dealing with online publications. In the professional world, you will need to find out field-specific or company-specific style and citation conventions.
Many bemoan the lack of a consistent style on web pages; inconsistency sometimes detracts from readability, can negatively affect the document’s/author’s ethos, and may create confusion that reduces clarity. We may not know who wrote the text, where it comes from, or when it was produced. Readers may hesitate to assign real credibility to an undated, unsourced blog written by a stranger—and rightly so. This is why sites like Wikipedia demand sources and format all entries exactly the same. The look and feel of Wikipedia is now familiar to people around the world, and it is used as a source in some writing contexts, for good or for ill, precisely because its content has predictable regularity and its easy-to-navigate entries are popular with readers. However, producing good publications involves much more than following style conventions. There are a variety of concepts to consider and many important choices to make when planning the best method of communicating your message.
5.3 Basic Guidelines
The first step in document design involves identifying the genre and its conventions (as discussed above), which may vary widely based on context, audience, and purpose. Here are some basic guidelines to keep in mind when dealing with business writing:
- Add and vary graphics. For non-specialist audiences, you may want to use more graphics—and simpler ones at that. Documents geared toward the non-specialist tend to have more decorative, technical, and detailed graphics.
- Break up text or consolidate it into meaningful, usable chunks. For non-specialist readers, you will likely construct shorter paragraphs of around six to eight lines. Technical documents written for specialists will include much longer paragraphs.
- Use headings and lists. Readers can be intimidated by dense paragraphs of writing.
(Technical writers may refer to a long paragraph that is difficult to scan as “a wall of prose.”) Incorporate headings whenever possible—for example, when a topic or subtopic is introduced. Also search your document for written lists that can be made into vertical lists. Look for paired listings such as terms and their definitions; these can become two-column lists. - Use special typography. Typically, sans-serif fonts, such as Ariel, are useful for online readers. Serif fonts, such as Time New Roman, are useful for print texts.
- Work with margins, line length, line spacing, type size, and type style. For non-specialist readers, you can increase readability by making the lines shorter (adjusting the margins) and using larger type sizes.
- Include bullet points. Long lists can often be broken down into smaller bulleted chunks of information for ease of reading. Some genres, like the résumé, place the emphasis on bulleted phrases rather than complete sentences. When using bullet points, keep in mind the following:
-
- Use a lead-in to introduce the list items and to indicate the meaning or purpose of the list (and punctuate it with a colon).
- Check spacing, indentation, punctuation, and caps to ensure consistency.
- Make list items parallel in phrasing.
- Confirm that each item in the list is parallel and grammatically correct.
- Avoid overusing lists; using too many lists destroys their effectiveness.
- Use similar types of lists consistently within the same document.
- Strive for balance and parallelism among elements. Keep in mind that items at the top of a document weigh more than those at the bottom, while items on the right side of the page weigh more than those on the left. Text and graphics should work together to create a sense of balance and unity.
In summary, while these basic guidelines may be applied to many different documents, the individual decisions you make will depend on your audience, or who will read your report. From content and language to layout, every aspect of your communication must keep your readers’ needs in mind.
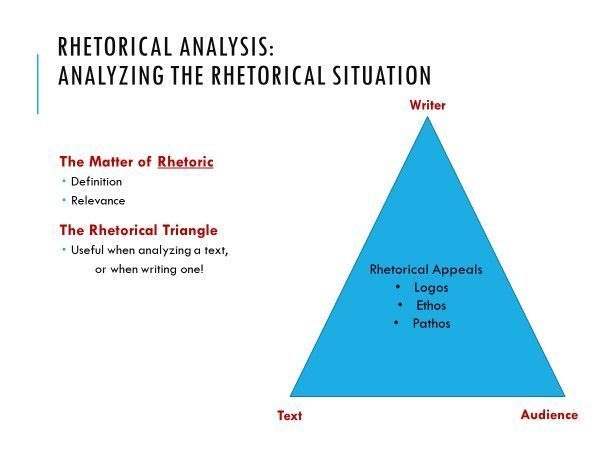
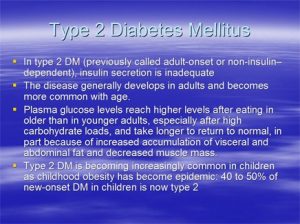
In the slide below, which of the principles above have been applied well? It utilizes both headings and subheadings to break materials into useable segments. It also includes bullet points, relying on fragments and phrases rather than full sentences, which encourages a speaker to elaborate on major points rather than over-relying on reading from the slide. The simplicity of the triangular graphic and color scheme could be said to enhance rather than detract from the main message. However, some might argue that the weight of the graphic on the right side throws off the visual’s balance (since items on the right weigh more than those on the left). A simple adjustment to the graphic’s size or placement would adjust the imbalance.
5.4 Creating and Integrating Graphics
Technical writers often integrate graphics or visuals to complement text in a report. Graphics can take many forms—tables, charts, photographs, drawings, to name a few—but their purpose rarely varies: they should help to clarify information presented in the report. They should work together with the text to communicate, rather than replacing the text altogether. Graphics provide an additional benefit. They help to break up a text-heavy report, making the report more visually appealing.
As you begin thinking about possible visuals to include in your document, the first step is to consider which graphics are most appropriate for the message you want to convey. The table below provides some general guidelines on the graphics most suitable to convey specific types of information.
| Information to Convey | Visual Type |
|---|---|
| Numbers, percentages, categories | Tables, charts |
| Processes | Flow charts |
| Geographic data | Maps |
| Chronological or prioritized lists | Numbered lists |
| Non-chronological lists | Bulleted lists |
Preparing Readers for Graphics
When developing graphics, you will want to consider where they should be placed and what information should surround them. Make sure your visuals are appropriate to your audience, subject matter, and purpose. To prepare readers for the information a graphic conveys, also consider these tips:
- Explain or introduce the information/topic of the graphic in the preceding paragraph.
- For easy reference, give each visual a name.
- Make sure the information within the graphic is clear and easy to understand.
- Whether above the visual or somewhere else in the document, provide source information, references, or citations (if the visual and/or data is not your original work and comes from a secondary source).
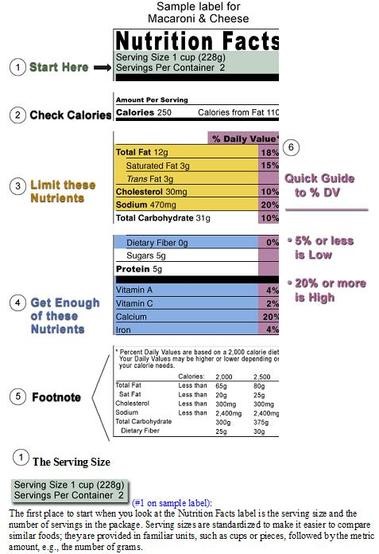
- Include a caption or follow-up text after the graphic, such as an interpretation or a final comment about the implications of the visual. If the graphic contains extensive data, you may need to tell your audience what information to focus on.
- Intersperse graphics and text on the same page. Avoid placing graphics on pages by themselves; ideally, no visual should take up more than one-third of a page unless absolutely necessary.
- Include identifying details within the graphics such as illustration labels, axis labels, keys, and so on.
- Leave at least one blank line above and below graphics.
- Place graphics near the text that they are illustrating. If a graphic does not fit on the same page, indicate that it appears on the next page.
- Cite all images that you take from elsewhere. While it is perfectly legal to borrow graphics—to trace, photocopy, scan, or extract subsets of data from them—you are obligated to accurately cite your sources for graphics. Also be aware that some graphics may require extra permissions from the creator based on the type of copyright.
Examples

Callouts and Captions
Callouts and captions contain information that help readers to interpret graphics; they identify specific elements or features. Whereas captions are short phrases or sentences that describe the graphic, callouts (or labels) are used when parts of the image need to be labeled or each part requires a longer explanation. Captions for graphics should be placed immediately under the graphic; they include the title and any explanatory material. Here are a few starting guidelines when creating captions: place words such as Figure, Illustration, and Table in bold type; italicize caption titles; and treat tables and figures just the same. Good captions guide readers not only to see, but also to understand.
Writing Style for Captions
The following paragraphs share five recommendations for style based on The Franklin Covey Style Guide for Business and Technical Communication. First, use interpretive captions whenever possible. Interpretive captions provide both a title and explanatory information, usually expressed in a complete sentence, to help readers understand the central point(s) that the writer wants to convey. A graphic and its caption should be clear and understandable without requiring readers to search for clarifying information in the text: “Figure 23-Check Valve. The risk of bad air entering the changer is near zero because the check valve permits air flow in one direction only.” This interpretive caption gives the title of the figure and emphasizes that the cabin has a constant temperature—a benefit provided by the feature described in the figure. The caption states clearly what the writer wants the reader to learn from the drawing.
Secondly, avoid using short or ambiguous titles to replace interpretive captions. In the past, styles for technical and scientific documents used only simple title captions for visuals. How would the effect of the Neuschwanstein visual change if the caption simply read “Castle”? Such a title makes the caption unnecessary, providing no real information other than the obvious to the reader. Titles that are so short and/or cryptic that they sound telegraphic are not useful.
Thirdly, number figures and tables sequentially throughout the document, and place the number before the caption. If an important figure or table is presented twice, treat it as two separate visuals and number each.
Fourthly, use periods following interpretive captions but omit punctuation following short captions that are not complete sentences. Interpretive captions are usually complete sentences and should therefore end with a period. Short captions, like titles and headings, are not usually complete sentences, so they require no punctuation. Captions may appear below or above a visual, but consistency throughout a document is critical. Arguments support both options; choose one, know the rationale for your choice, and be consistent.
Lastly, put the caption above the visual for better visibility when captions are used with slides and other project visual aids. Captions placed at the bottom may be blocked by the heads of those seated in front or the limits of the projector/screen. Safety information must also be accessible to your readers. Warnings should stand out from the rest of the documents, possibly with icons, colored fonts, or bolding. They should also be easy to understand. A confusing safety label is just as bad as no warning at all.
To give a warning prominence, you may decide to list it at the beginning of the manual; be sure to also list hazards where the reader might encounter them in your instructions. In the case of technical instructions where action is required, list the safety label before the step to ensure that the reader sees the information in time to prevent mishap. As a preemptive strike against lawsuits, you may be tempted to list every possible hazard that comes to mind. Some companies do this to an extent that the warnings become ridiculous—i.e. “Do not use this rotary drill as a home dentistry kit” or “Do not use your hairdryer while sleeping.” Keep in mind that too many warnings—especially ridiculous ones—make the whole safety section seem silly. Then, no one takes the hazard seriously, not even the real ones. Remember: You only have to inform users when a hazard is “reasonably foreseeable.” In other words, find the middle ground between not enough warnings and way too many.
Guidelines for Callouts
Here are a few additional guidelines for callouts:
- Determine the number of items to identify in the image.
- Create a consistent visual style.
- Use the same terms on the callout as in the text.
- Place callouts next to the elements in the graphic they identify, using a line to connect the two, if necessary.
- Use a standard font and size for readability.
- Align the labels and callouts for a neater appearance.
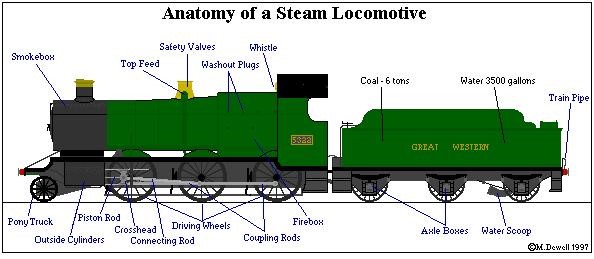
The following graphic adopts a consistent visual style in the way that it identifies the parts of a locomotive. Its terms are placed directly next to the graphic, connected by lines. Its title is placed above rather than below the visual for easy differentiation from the callouts.
Types and Placement of Callouts
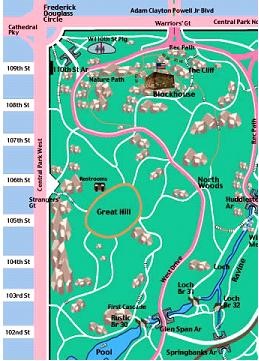
Callouts typically take one of three different forms: 1) They may be placed directly on the graphic (whereby they become part of the visual), 2) They may be placed around the graphic near lines that point to the relevant element in the graphic, or 3) They may include links or hotspots where more information about the element is displayed on mouse rollover or on another page. The visuals below feature two of the three major label types.

When to Use Callouts
Callouts are best used when many parts of the image need to be labeled and each part requires a longer explanation. In fact, the label sequence may be in alphabetical or numerical order, as shown in the example below. Ensure that the explanation is near the graphic.
5.5 Tables of Contents
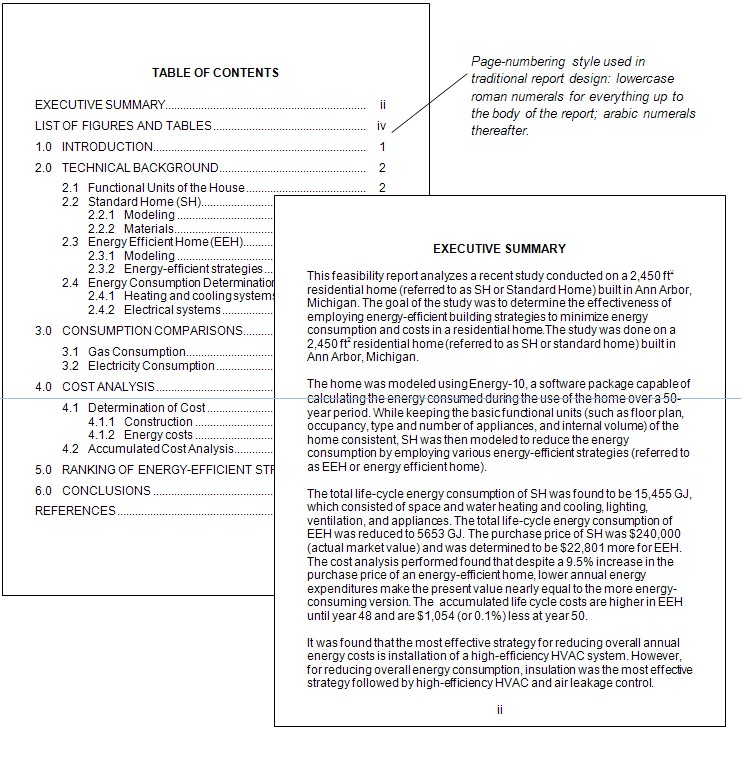
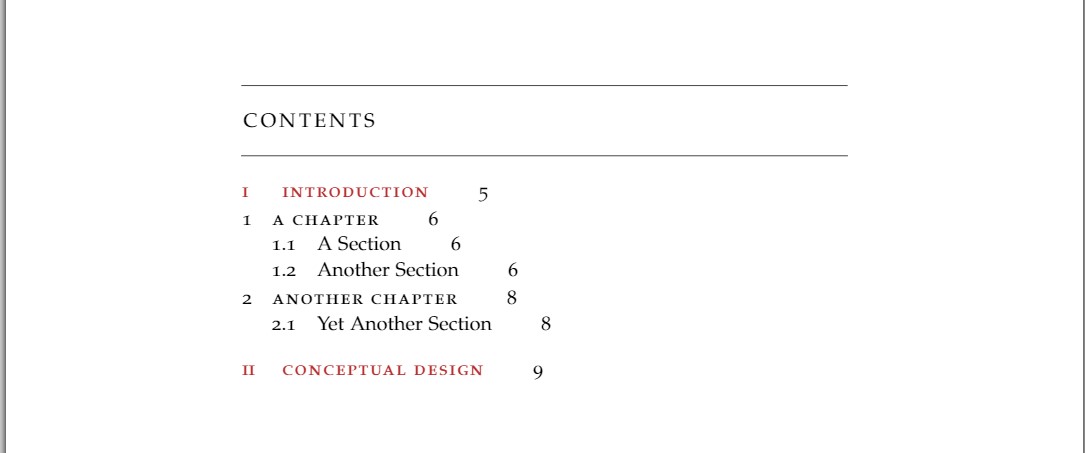
Most people are familiar with tables of contents (TOC), but have you ever stopped to look at their design? The TOC shows readers what topics are covered in the report, how those topics are discussed (subtopics), and on which page numbers sections and subsections start. In creating a TOC, you will have to make design decisions having to do with levels of headings, indentation, spacing and capitalization. Such decisions keep the TOC from becoming long and unwieldy; it should provide an at-a-glance way of finding information in the report quickly.
In the illustration below, items in each of the three levels of headings are aligned. Main chapters or sections are written in all capital letters, first-level headings use initial capitals on each main word, and lower-level sections use initial capitals on the first word only. The first-level sections also have extra space above and below, which increases readability. Using the automatic TOC creator in your word processor can help you produce a clean, professional document. If you prefer to make your own, use dot leader tabs to line up the page numbers correctly. See the following example of a table of contents:
5.6 Figures and Tables
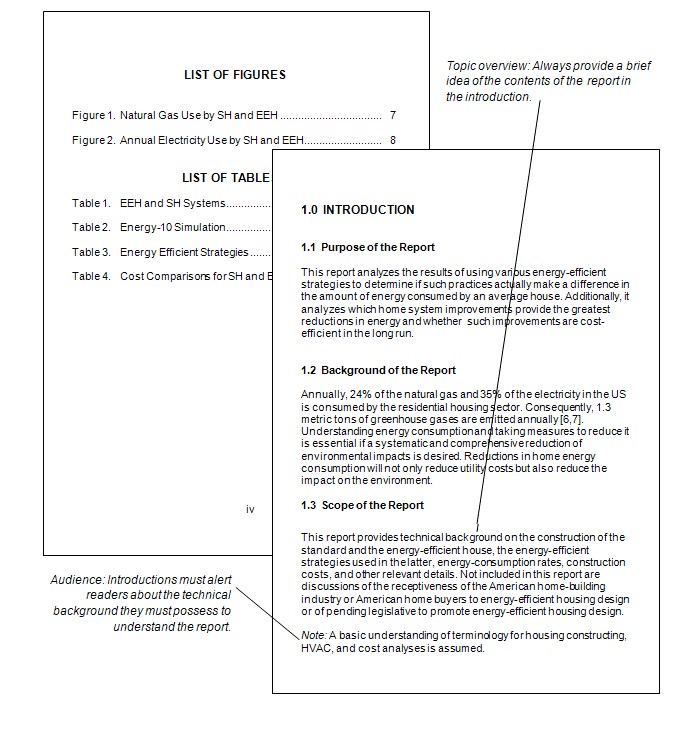
If your document has more than two figures and tables, create a separate list of figures. The list of figures has many of the same design considerations as the table of contents. Readers use it to quickly find the illustrations, diagrams, tables, and charts in your report. Complications arise when you have both tables and figures. Strictly speaking, figures are illustrations, drawings, photographs, graphs, and charts. Tables are rows and columns of words and numbers; they are not considered figures.
For longer reports that contain dozens of figures and tables each, create separate lists of figures and tables. Put them together on the same page if they fit, as shown in the illustration below. You can combine the two lists under the heading List of Figures and Tables and identify the items as figure or table as is done in the illustration below.
5.7 Headings
In all but the shortest reports (two pages or less), use headings—titles and subtitles—to mark off the different topics covered. Headings are an important feature of professional technical writing: they alert readers to upcoming topics and subtopics, help them find their way around in long reports, and break up long stretches of straight text. They are also useful for keeping writers organized and focused on the topic. When some writers begin using headings, they are tempted to insert them after writing the rough draft. Instead, take time to visualize the headings before starting the rough draft, and plug them in as you write. Here are helpful tips for headers:
- Make phrasing self-explanatory: instead of Background or Technical Information, be more specific, like Physics of Fiber Optics.
- Indicate the range of topics covered in the section: if the section covers the design and operation of a pressurized water reactor, the heading Pressurized Water Reactor Design may seem incomplete and misleading.
- Do not use stacked headings (consecutive headings without intervening text).
- Avoid pronouns referring to headings: if you have a heading like Torque, do not begin the sentence following it with: “This is a physics principle.”
- Omit articles from the beginning of headings: The Pressurized Water Reactor can easily be changed to Pressurized Water Reactor.
- Avoid widowed headings: widowing occurs when a heading is placed at the bottom of one page and the text starts at the top of the next page. Keep at least two lines of body text with the heading or place all the information on a new page.
Manually formatting each heading using the guidelines presented above will lead unnecessarily repetitive work. The styles provided by Microsoft Word, OpenOffice Writer, and other software save you this work. You can simply select Heading 1, Heading 2, Heading 3, and so on.
5.8 The CRAP Test
Despite the unfortunate acronym, the major four principles of CRAP are familiar to any graphic designer and they should be familiar to writers as well. This guideline originated with the influential designer and writer Robin Williams; she now regrets the acronym, but not the ideas behind it.
1. C is for Contrast: Use difference to draw readers’ eyes to and through your text or publication.
You can see evidence of the most basic aspects of contrast in any web page or magazine. The headline text is always different from the body text. It is often bigger and bolder; it can also be in a different typeface. Headlines make it easy to skip from one story to the next and get a cursory understanding of the news.
Applying strong contrasting elements to your text is important because the human eye is drawn to difference, not necessarily size. When everything looks the same, it is difficult to focus on anything. When things are different, they are more noticeable. When a document has few or no contrasting elements, nothing stands out. The document is not easy to scan, and it does not invite the reader to jump in and read. It is also difficult for readers to glean information from the text easily and quickly.


Some documents, like business letters or academic papers, have fewer contrasting elements, but even line spacing and paragraph breaks help indicate where a related chunk of information begins and ends. Contrast helps draw the reader’s eyes to specific elements in your text, and it also helps the reader follow the flow of the information, while assessing which items are most important and require immediate attention. It creates readability. The following elements of a text can help you create a friendly, appealing sense of contrast:
Contrast in size: Your eye moves toward things because they are different, not because they are large or small. Your eye is impressed by novelty more than sheer size or color or any other visual characteristic. There are all sorts of scientific theories about why this is so, but in short, it is not so much that making something bigger makes it more noticeable. A person’s height, for example, is not so noticeable until the principle of contrast comes into effect. There is such a thing as too much size contrast: think of those web sites with huge type or an overly enthusiastic use of the CAPS LOCK key. Less is more, but some size contrast is essential to draw the reader’s eye.
Contrast in font size/style/weight: A typeface is a collection of fonts. The distinction between the terms typeface and font stretches back to the days of typesetting: hand-placing individual letters made of wood or metal, inking them, and rolling paper over them. In the digital age, most people use the words typeface and font interchangeably, though the distinction still matters to experts like designers and typographers.
What is important to most people is that we all have a huge variety of typefaces, or font families, to choose from: Times New Roman, Arial, Bookman, Georgia, and Garamond are familiar to many of us. It is important to choose a font (a particular size, style, and weight within a typeface) that fits our purpose. Some, like script and handwriting typefaces, are too hard to read and thus inappropriate for body text, for example. Some typefaces work well as headlines: Franklin Gothic Condensed and Caslon are two typefaces often used for newspaper headlines. The “font” chosen (size, weight, style—italic, bold, etc.) will be the designer’s choice.
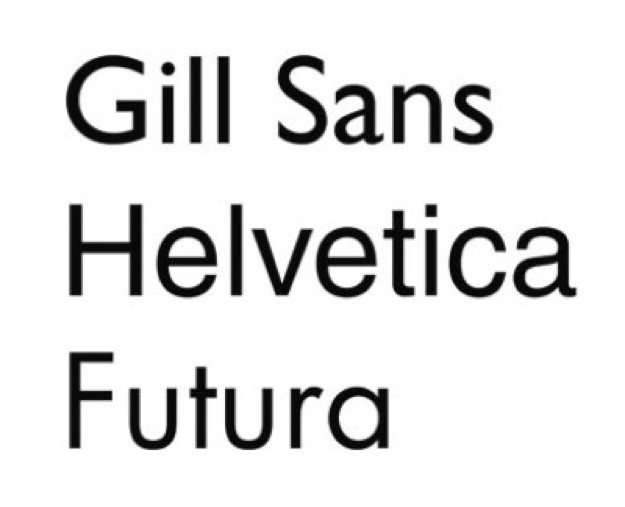
It is also important to distinguish between serif and sans-serif fonts. Sans serif fonts, like Helvetica or Futura, are simple and smooth; the letters do not display the feet and ornamentation (serifs) that serif fonts do. Sans serif fonts are often used for headlines, but serif fonts are more likely to be used for body text. Many typographers think serif fonts (also called Roman fonts) make large blocks of body text easier to read. Some of the preference is really just about tradition.
Contrast in Direction (vertical, horizontal, circular, etc.) or position (top, bottom, side): Changing the direction or orientation of text, graphic elements like lines, banners, or screens.
Contrast in alignment (center, left, right, justified): A change in alignment can create visual interest. For example, headlines are often centered to make them noticeable. Images may be placed in a location on a page (or slide) to draw readers’ attention in one direction or another. Consistent alignment with slight variations to provide interest is particularly important in PowerPoint presentations. You will be flipping from one slide to another, and if the text blocks and headlines are not aligned identically, your text and headlines will appear to jump around the screen in a distracting way.
Contrast in graphic elements like photos, banners/bands, pull quotes, or logos: Breaking up huge blocks of text with a variety of graphic elements can really add visual appeal and interest. As with the examples below, less is more. Think of all the publications and web sites you have seen whose designers thought it was awesome to make text bold AND underlined AND multicolored AND flashing. With a bright yellow background. And too many animated GIFs. It repels readers rather than attracting them.

Contrast in color (of background, text, graphic elements, etc.): Use color to make certain elements stand out. Create a sense of drama when you contrast one color with another. Make sure you do not use too many colors and your color combinations are easy to read.
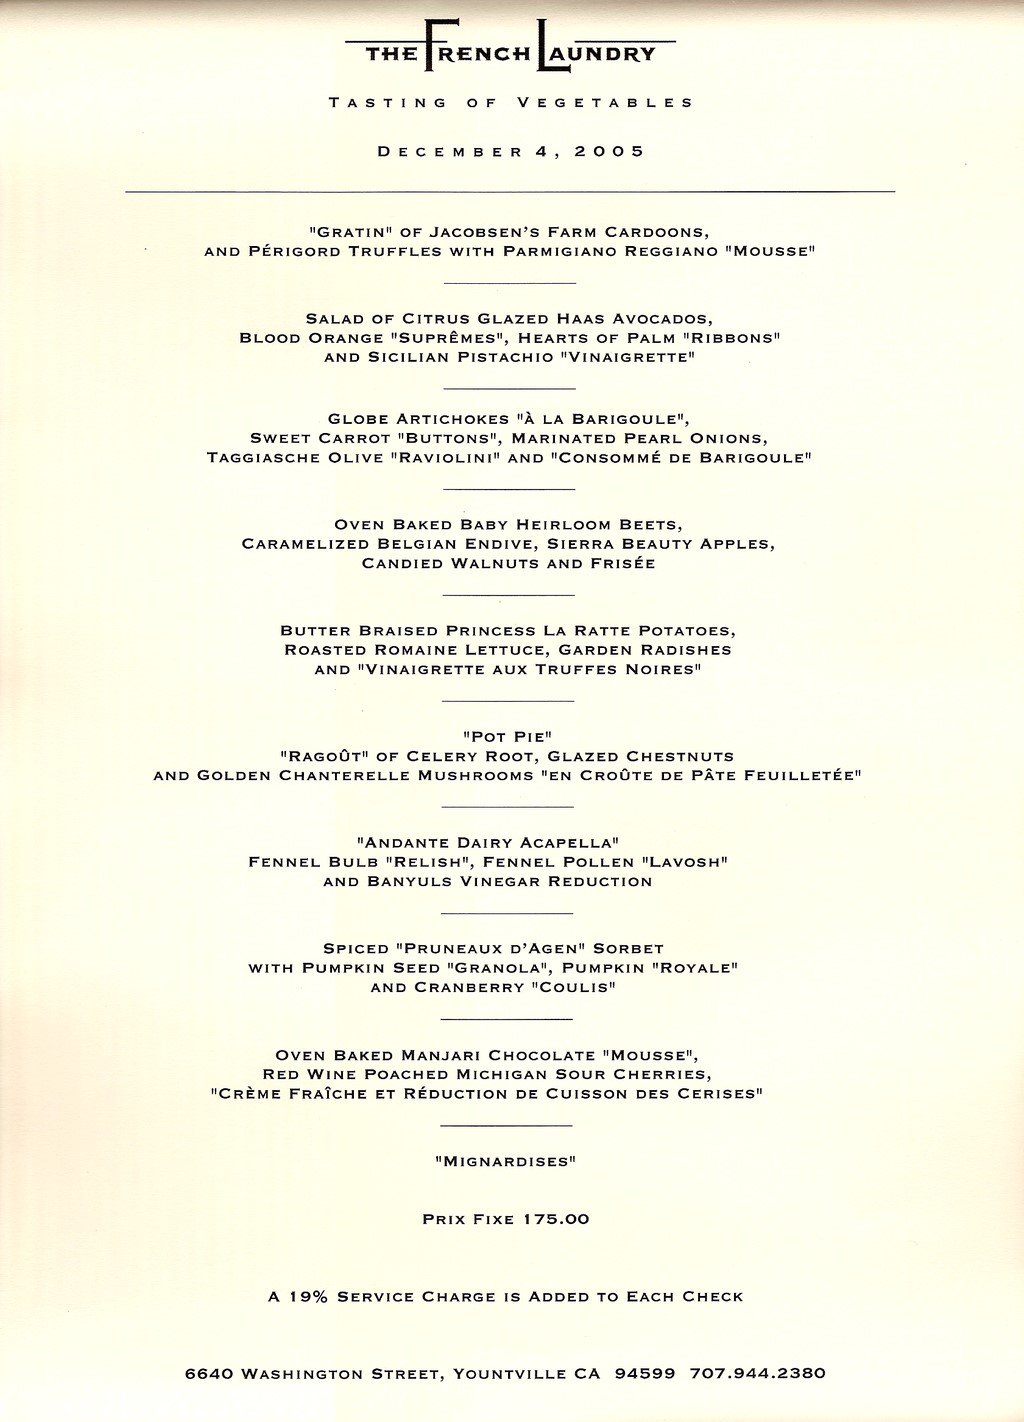
Contrast in negative or white space: Sometimes, the best way to attract a reader’s attention to a contrast is by using negative space. Negative space, or white space, describes the space around text, images, and other elements in a document. The absence of content draws attention to the content itself. It makes documents of all kinds (digital and print) more readable, more restful-looking, more inviting to the reader, simpler, and more elegant. It is associated with that high-end restaurant or salon menu look.

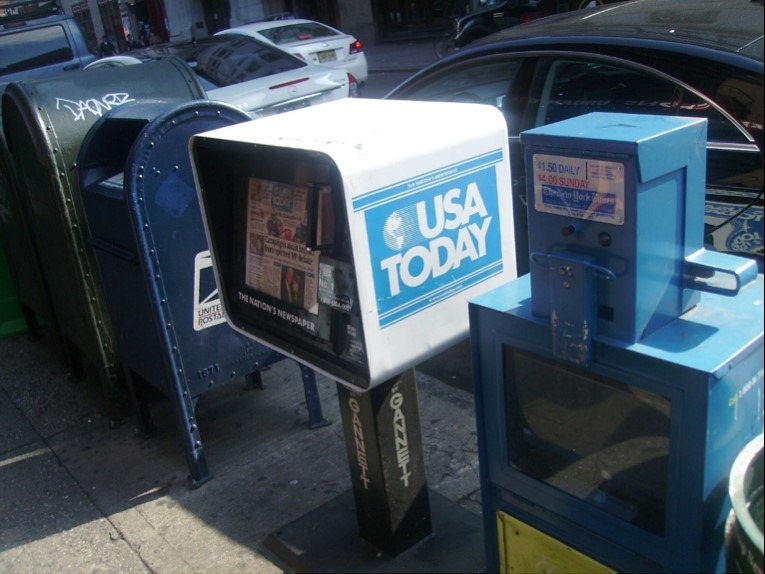
- R is for Repetition: Repeat design strategies throughout your document to provide a sense of connection.The basic rule of repetition means that in any text, visual or textual elements that have similar functions should be formatted similarly to create continuity and show close relationships between the elements. For example, newspapers have consistent ways of labeling different sections, like Sports, that does not change on a daily basis, but there is also design consistency throughout so that you can identify the newspaper. For example, in a standard newspaper all the column widths utilize consistent spacing, which increases visual appeal through uniformity and repetition. USA Today in particular is notorious for its consistent repeated color-coding and design.
On a smaller scale, in a résumé most applicants use bullet-pointed sections to list their job duties. Repetition in this context means that all these bullet points should be formatted identically: the same font, size, line spacing, and indentation. Each group of bullet-pointed items should be the same distance from the text above and below. The bullet points themselves should be exactly the same shape and size. Repetition also applies to styles like MLA or APA. All titles are centered. All page numbers are in the upper right-hand corner, after your last name and a single blank character space. The same typeface is used throughout the paper. All paragraphs have exactly one empty line space between them. And so on.
Repetition means that every line classified as a headline should look like a headline, and headlines formatted to look alike can be identified as having a similar function in the text. The same principle applies to body text. Fonts should not change without a reason. Lines, logos, and other graphic/visual elements should be formatted consistently. This repetition provides a sense of order and continuity that makes the document more readable and professional looking.
Since managing the formatting of multiple elements by hand can be difficult, many software programs provide templates—ready-made layouts into which you can plug your text and photos and thereby produce a variety of documents with a consistent look and feel. Microsoft Word, for example, also allows you to set Styles that will keep formatting choices like size, font, and style (bold, italic, etc.) the same for blocks of text with the same functions (body text, headlines, bullet points, subheadings). Templates for newsletters, résumés, and PowerPoint presentations ensure that basic design elements like font size/style, color, image size and alignment are consistent from page to page. Templates provide a quick, easy way to solve repetition issues. Look at the difference repetition makes in even the most basic of résumés, for example.
- A is for Alignment: There should be a clear, deliberate arrangement of items on a page.
Alignment can refer to text, as in the left-aligned body text required in MLA style. But in document design, it means much more; it refers to how the entire document is arranged. Most designers align all their content to some sort of a grid or pattern, creating a distinct, intentional arrangement of items on a page or screen. They use plenty of white space to cushion the items, which makes higher-contrast items pop.
In the following sample Table of Contents, not only are the numbers misaligned, but the TOC also lacks leader lines, which detracts from the document’s professionalism (possibly undermining the writer’s credibility with readers).
- P is for Proximity: Items that have similar functions or purposes should be grouped together.
When we work with pictures and blocks of text, think of this: placing design or text elements next to each other in certain ways helps readers to see the relationship among elements. For example, photos and figures have captions that explain their contents. Nearby images often illustrate the content found in body text. Headlines are placed above body text whose content and focus they describe in briefer form.
Proximity can be especially critical in booklets, newsletters, and brochures, in which certain pages or panels might be grouped together under a subheading. Individual pages can be designed to reflect a larger relationship with the overall theme or subject matter. For example, the themes provided by blogging platforms like WordPress take care of this for you—every page will have a recognizable layout and though individual pages might be slightly different, they will be recognizably related to the blog’s main page. Web sites work the same way, as do book chapters.
The principle of proximity even affects white space: equal amounts of white space and equal line spacing indicate that items are related or should be considered as parts of a whole.
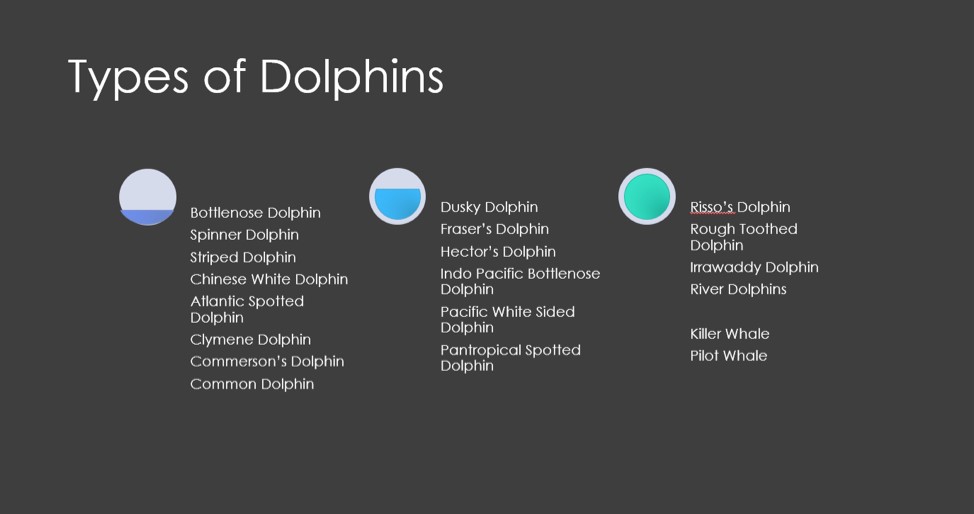
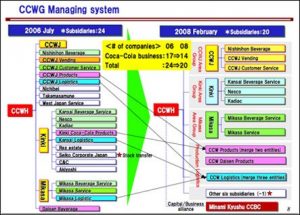
The PowerPoint slide above is very confusing. Why are there three different groupings under one headline, and why is each column grouped under a different graphic? Note the two whales
listed in the far bottom right. They are actually types of dolphins, but their relatively distant position (proximity) from the others in their group makes it look as if they are not. There are no headlines or labels here to help us group these lists, and the design strategy is not doing readers any favors.
Planning and adjusting how items are grouped on a page helps you design your text, graphics, and images so that readers can see relationships: what goes together, what is different, and what is similar. Relationships between items should be clear.
5.9 Cross-Cultural Audience Considerations
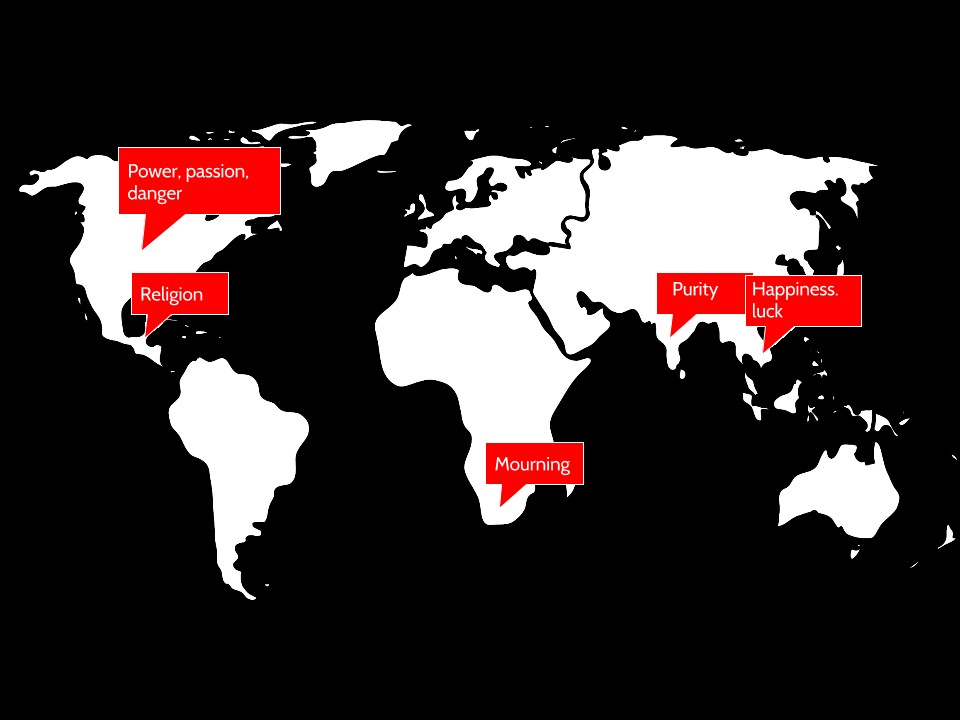
When creating graphics, it is very important to keep your audience in mind. This relates not just to the content you share, but also how that content appears on the page. Are you aware, for instance, that the same color has different meanings across various cultures? Take a look at the graphic below and notice how the color red means something very different across culture.
Similar differences exist across cultures with other colors, as well, so be aware that the choices you make in colors for your graphics may communicate ideas you do not actually intend.
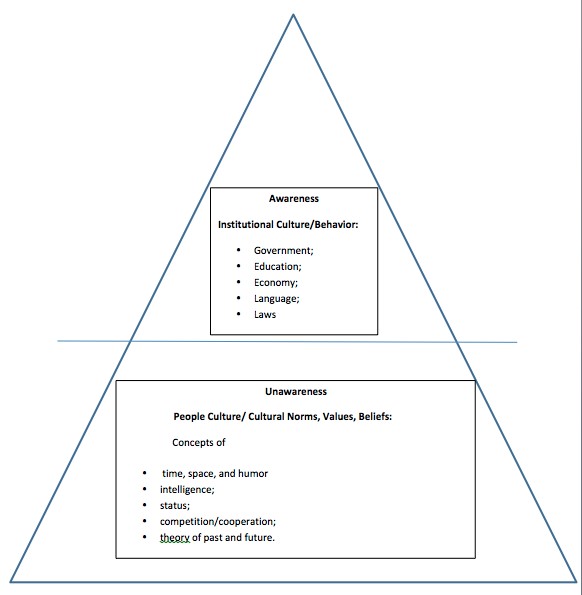
Technical writers need to be aware of cultural differences in behaviors, norms, beliefs, and values. According to Edward T. Hall and Mildred Reed Hall, in Understanding Cultural Differences, each culture operates according to its own rules (1990, pp. 3-4). Hall and Hall add that problems occur when members of one culture apply the rules to another culture (1990, pp. 3-4). To communicate effectively with other cultures, the technical writer needs to not only be aware of (explicit or stated) rules governing behaviors that can be observed, but also of the not-so-obvious (tacit or unstated) rules. The invisible rules of a culture dramatically impact the acceptance of ideas, plans, and strategies. The Cultural Iceberg below illustrates patterns of world communication, showing indicators of Institutional Culture (the obvious behavior of a culture), which can be clearly seen as the tip of the iceberg, and People Culture (the norms, beliefs and values of a culture), which cannot be seen and which may provide barriers to successful communication. (See Chapter 2 on audience for more information on how to revise with differing cultural expectations in mind.)
5.10 Additional Document Design Resources
Citing Images
- Purdue OWL: https://owl.purdue.edu/owl/research_and_citation/mla_style/mla_formatting_and_style_guide/mla_works_cited_other_common_sources.html
- EasyBib: http://www.easybib.com/mla-format/digital-image-citation
MS Word
- https://www.pcworld.com/article/2146761/word-s-secret-design-sizzle-learn-the-built-in-tools-for-better-looking-documents.html
- PCWorld: https://support.office.com/en-us/article/Create-a-document-3AA3C766-9733-4F60-9EFA-DE245467C13D
Google Slides
- WikiHow: https://www.wikihow.com/Create-a-Presentation-Using-Google-Slides
- Using Google Slides: https://docs.google.com/document/d/1Rxw4DRvWizdHh21CIOrE8sCdV92bQ2GetHFMAp0grC4/edit#!
- Google Slides Tutorial: https://www.bing.com/videos/search?q=using+google+slides&view=detail&mid=7FF39D545F709D5DC5FE7FF39D545F709D5DC5FE&FORM=VIRE
PowerPoint
- Microsoft Office: https://support.office.com/en-us/article/Create-and-save-a-PowerPoint-template-EE4429AD-2A74-4100-82F7-50F8169C8ACA
- WikiHow: https://www.wikihow.com/Create-a-PowerPoint-Presentation
5.11 Suggested Activities
ACTIVITY 1: Go online or take a walk around your town. Find a publication (print or electronic) that conveys messages clearly. Critique it according to the principles in this chapter. Also find an example of a publication that does not achieve its goal. See if you can identify and describe which of principles are not being followed in the second example.
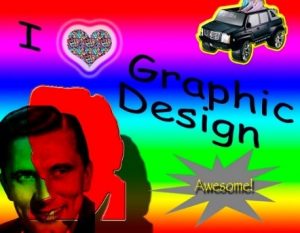
ACTIVITY 2: Check out the poorly designed PowerPoint slides below. Using the principles learned in this chapter, what elements need to be adjusted to increase effectiveness?
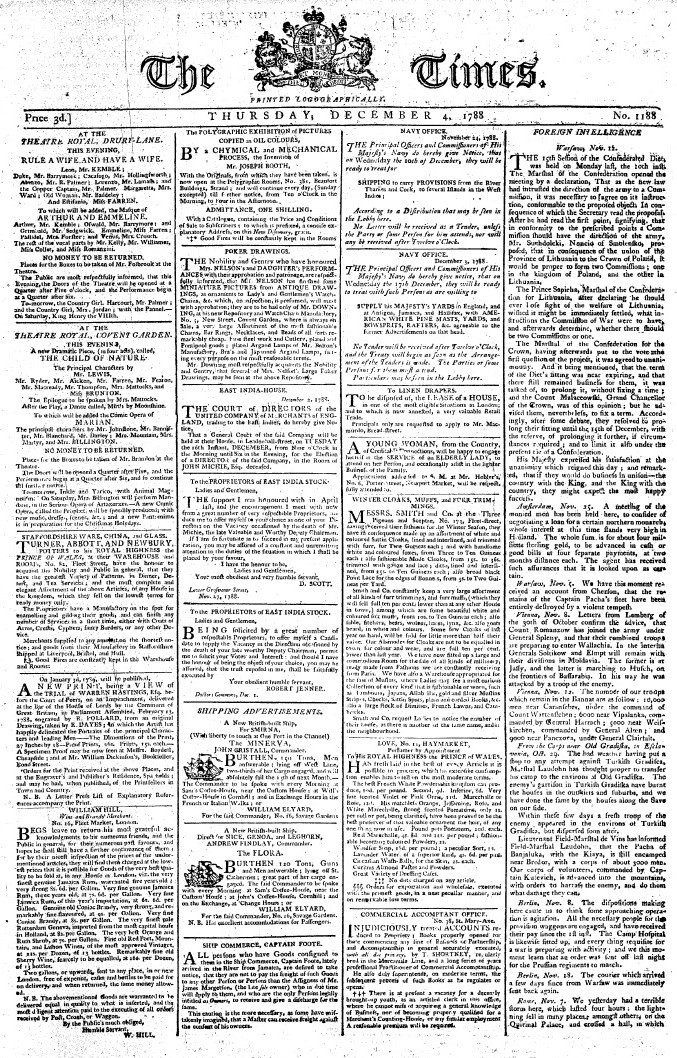
ACTIVITY 3: Just looking at the front page makes me tired! Discuss texts that you have found intimidating or hard to read because of their layout or appearance. What exactly made the text difficult to read?
Attribution
Material in this chapter was adapted from the works listed below. The material was edited for tone, content, and localization.
Technical Writing, by Allison Gross, Annamarie Hamlin, Billy Merck, Chris Rubio, Jodi Naas, Megan Savage and Michele DiSilva, licensed CC-BY-NC-SA.
ENGL 145 Technical and Report Writing, by the Bay College Online Learning Department, licensed CC-BY.
