
30 Effects of math teachers’ attitudes toward computer use on their perceived usefulness of computer-based reading scaffolds in students’ math achievement
Seoyeon Park
Abstract
The purpose of this study is to examine how math teachers’ attitudes toward computer use can affect their perceived usefulness of computer-based scaffolds for reading in mathematics (RIMS). We applied the Technology Acceptance Model (Davis, 1989) to develop measures in terms of three aspects: perceived ease of using RIMS, perceived usefulness of RIMS for teachers, and perceived usefulness of RIMS for students. In addition to TAM, we added teachers’ attitudes toward computer use in their daily teaching practices in this evaluation model. The structural equation modeling was used to test the relationships among four factors. One hundred and forty-eight middle or high school math teachers in the United States participated in the tool evaluation to assess the preliminary usability and usefulness of RIMS. Most teachers who participated in the tool evaluation responded that using RIMS will help them teach math and improve students’ mathematical knowledge. When considering teachers’ attitudes toward computer use (CA), we found that CA directly or indirectly influences perceived ease of use and usefulness of the tool. This implies that teachers tend to predetermine the usefulness of the technology for their teaching and students’ learning based on their preferences on computer use. This finding can expand the TAM model by explaining how users’ attitudes toward computer use can affect their use of the target technology. Furthermore, this finding suggested that it is important to support teachers to have positive attitudes toward computer use so that they can integrate technology into their curriculum and instruction.
Literature Background
Disciplinary Reading in Math
While many consider reading and math to be separate, reading is enormously influential in students’ learning in mathematics (Halliday, 1978; Pimm, 1987; Adams, 2003; Shanahan & Misischia, 2011). This is because of unique features of reading in math in which students need to interpret words and symbols in abstract forms, differentiate words with multiple definitions (e.g., square, degree, volume), and cross-check words, images, tables, or graphs (Adams, 2003; Fang & Schleppegrell, 2010). Thus, supporting reading development can allow students to understand how math concepts are constructed and extend their mathematical knowledge in context-rich scenarios (Galasso, 2019). Several studies suggested strategies to address the reading problem in mathematics. Many of those studies emphasized multiple exposures to math vocabulary (Bowers et al., 2010; Scammacca et al., 2016), interactive read-alouds for digesting informational texts (Bortnem, 2008), active engagement in reading mathematical texts by summarizing the content, and letting students discuss about key terms with peers (Carlisle, 2010). However, most of the suggestions are highly dependent on teachers’ experience and skills, and there are very few studies verifying the effects of these suggestions on improving students’ knowledge in mathematics. Thus, we developed RIMS (Reading In Math Scaffolds), which is a web-based learning environment with computer-based reading scaffolds that can promote students’ reading literacy and learning in math. The description of RIMS is articulated in the Methods Section.
The relationship among teachers’ perceived ease of use, perceived usefulness, and attitudes toward computer use
We applied the Technology Acceptance Model (Davis, 1989) to develop measures for teachers to evaluate RIMS in terms of three aspects: perceived ease of using RIMS, perceived usefulness of RIMS for teachers, and perceived usefulness of RIMS for students. TAM is a model explaining how users come to accept and use a target technology. In TAM, perceived usefulness and perceived ease of use are two crucial factors that impact users’ decisions about whether they use the technology or not.
Perceived ease of use refers to the degree to which a person perceives that using a target technology will be free of mental and physical effort (Davis et al., 1989). The technology can have better chance to get accepted by users when it has a high level of perceived ease of use (Davis, 1989). In the tool evaluation, teachers were asked to evaluate how easy RIMS were for them to use. Perceived usefulness is defined as the degree to which a person perceives that using a particular technology will improve his or her work performance (Davis, 1993). People tend to use the technology more often when they believe it can make them more effective in their work (Davis et al., 1989). Since RIMS has been invented to support teachers’ instruction for disciplinary literacy and improve students’ math knowledge by assisting their reading in math, the tool evaluation includes how useful RIMS will be in accomplishing these purposes. Perceived usefulness for teachers includes decreasing the time for class preparation and teaching math concepts and problem-solving more efficiently. Perceived usefulness for students’ learning includes enhancing students’ conceptual and procedural knowledge in math with RIMS from teachers’ perspectives.
In addition to two factors of TAM, we added teachers’ attitudes toward computer use in their daily teaching practices in this evaluation model. Many studies suggested that teachers attitudes toward computer use are deeply related to teachers’ perception of the usefulness of the educational technology and computer-based learning environments (Askar & Umay, 2001; Teo, 2006). Thus, how teachers view computer use can affect their beliefs regarding the effectiveness of RIMS for teaching and learning activities. Teachers’ attitudes toward using computers can also influence the level of teachers’ perceived ease of use directly since those who like to use computers are highly likely to be more competent and interested in using computers for their work and daily lives (Ngai et al., 2007; Phillips, Calantone & Lee, 1994).
The purpose of this study is to evaluate RIMS from teachers’ perspectives and examine how teachers’ attitudes toward computer use affect their perceived usefulness of RIMS. According to the literature reviewed above, we hypothesized the relationship among teachers’ attitudes toward computer use (CA), teachers’ perceived ease of using RIMS (PE), perceived usefulness of RIMS for teachers (PUT), and perceived usefulness of RIMS for students’ learning (PUS) as follows (Figure 1).
H1. CA is positively related to PE, PUT, and PUS.
H2. PE is positively related to PUT and PUS.
H3. PUT is positively related to PUS.
H4. The relationship between CA and PUT is mediated by PE.
H5. The relationship between CA and PUS is mediated by PE and PUT.
Methods
Tool development
RIMS was developed to assist students’ learning in math with computer-based reading scaffolds. The content of RIMS includes an Algebra 1 coordinate geometry section skill set. Each chapter has text paragraphs, images, a problem set, and several reading scaffolds. We embedded diverse learning strategies in RIMS. First, students can see the resources with images of the mathematical word when they hover their cursor. Because many studies emphasized increasing the familiarity with math vocabulary, students can comprehend the math concept better with this vocabulary help. Moreover, we highlighted key terms in the text so that students can recognize the important concepts. Second, students can use self-summary boxes for summarizing the content before they solve the questions. Summary writing is regarded as an effective method to improve reading comprehension since it makes students engage in reading actively and also helps them to recall what they read (Meyer & Ray, 2017). Hagen et al. (2014) also stated that self-summary during reading can be a great tool for meaningful and transformative digestion of the material. Lastly, we added ‘why’ questions that encourage students to connect the cause-and-effect relationships among math concepts. Each ‘why’ question has hints that students can use. Students should fill the self-summary box and work on ‘why’ questions for each chapter before they solve the question set.
Procedures
In this study, 148 middle or high school math teachers in the United States (129 middle school, 19 high school) participated in the tool evaluation to assess the preliminary usability and usefulness of RIMS. Participants were asked to examine RIMS and respond to the evaluation survey. All evaluation was conducted online. The measures for the tool evaluation survey are created by modifying the TAM questionnaire (Davis, 1989; Teo & Van Schalk, 2009). It includes four questions about PE, five questions for PUT, and three questions about PUS. In addition to TAM, we also adopt a scale for the CA from Thompsonet et al (1991) to check teachers’ attitudes toward computer use in daily teaching practices and how this characteristic influences the web-based tool evaluation. Participants gave their opinions on each survey item on a 5-point Likert scale, ranging from 1 (strongly disagree) to 5 (strongly agree). Table 1 specifies the survey questions and the reliability of each construct in the measures. The statistical analysis was comprised of two stages. The first stage analyzed the descriptive statistics of the measurement items to figure out teachers’ evaluation on RIMS. The second stage tested the relationships among four factors (CA, PE, PUT, and PUS) with the structural-equation modeling (SEM) approach.
Results
The descriptive statistics for each survey item are shown in Table 2. All means were greater than 3.5, ranging from 3.71 to 4.26. This indicates an overall positive response across four constructs in the measurement. Table 3 shows the frequency and percentage of responses for each item. Around 85% of teachers responded that it was easy to understand how to interact with RIMS. 80-85% of teachers agreed that RIMS will help them teach the content more efficiently and improve students’ learning in math concepts and problem-solving.
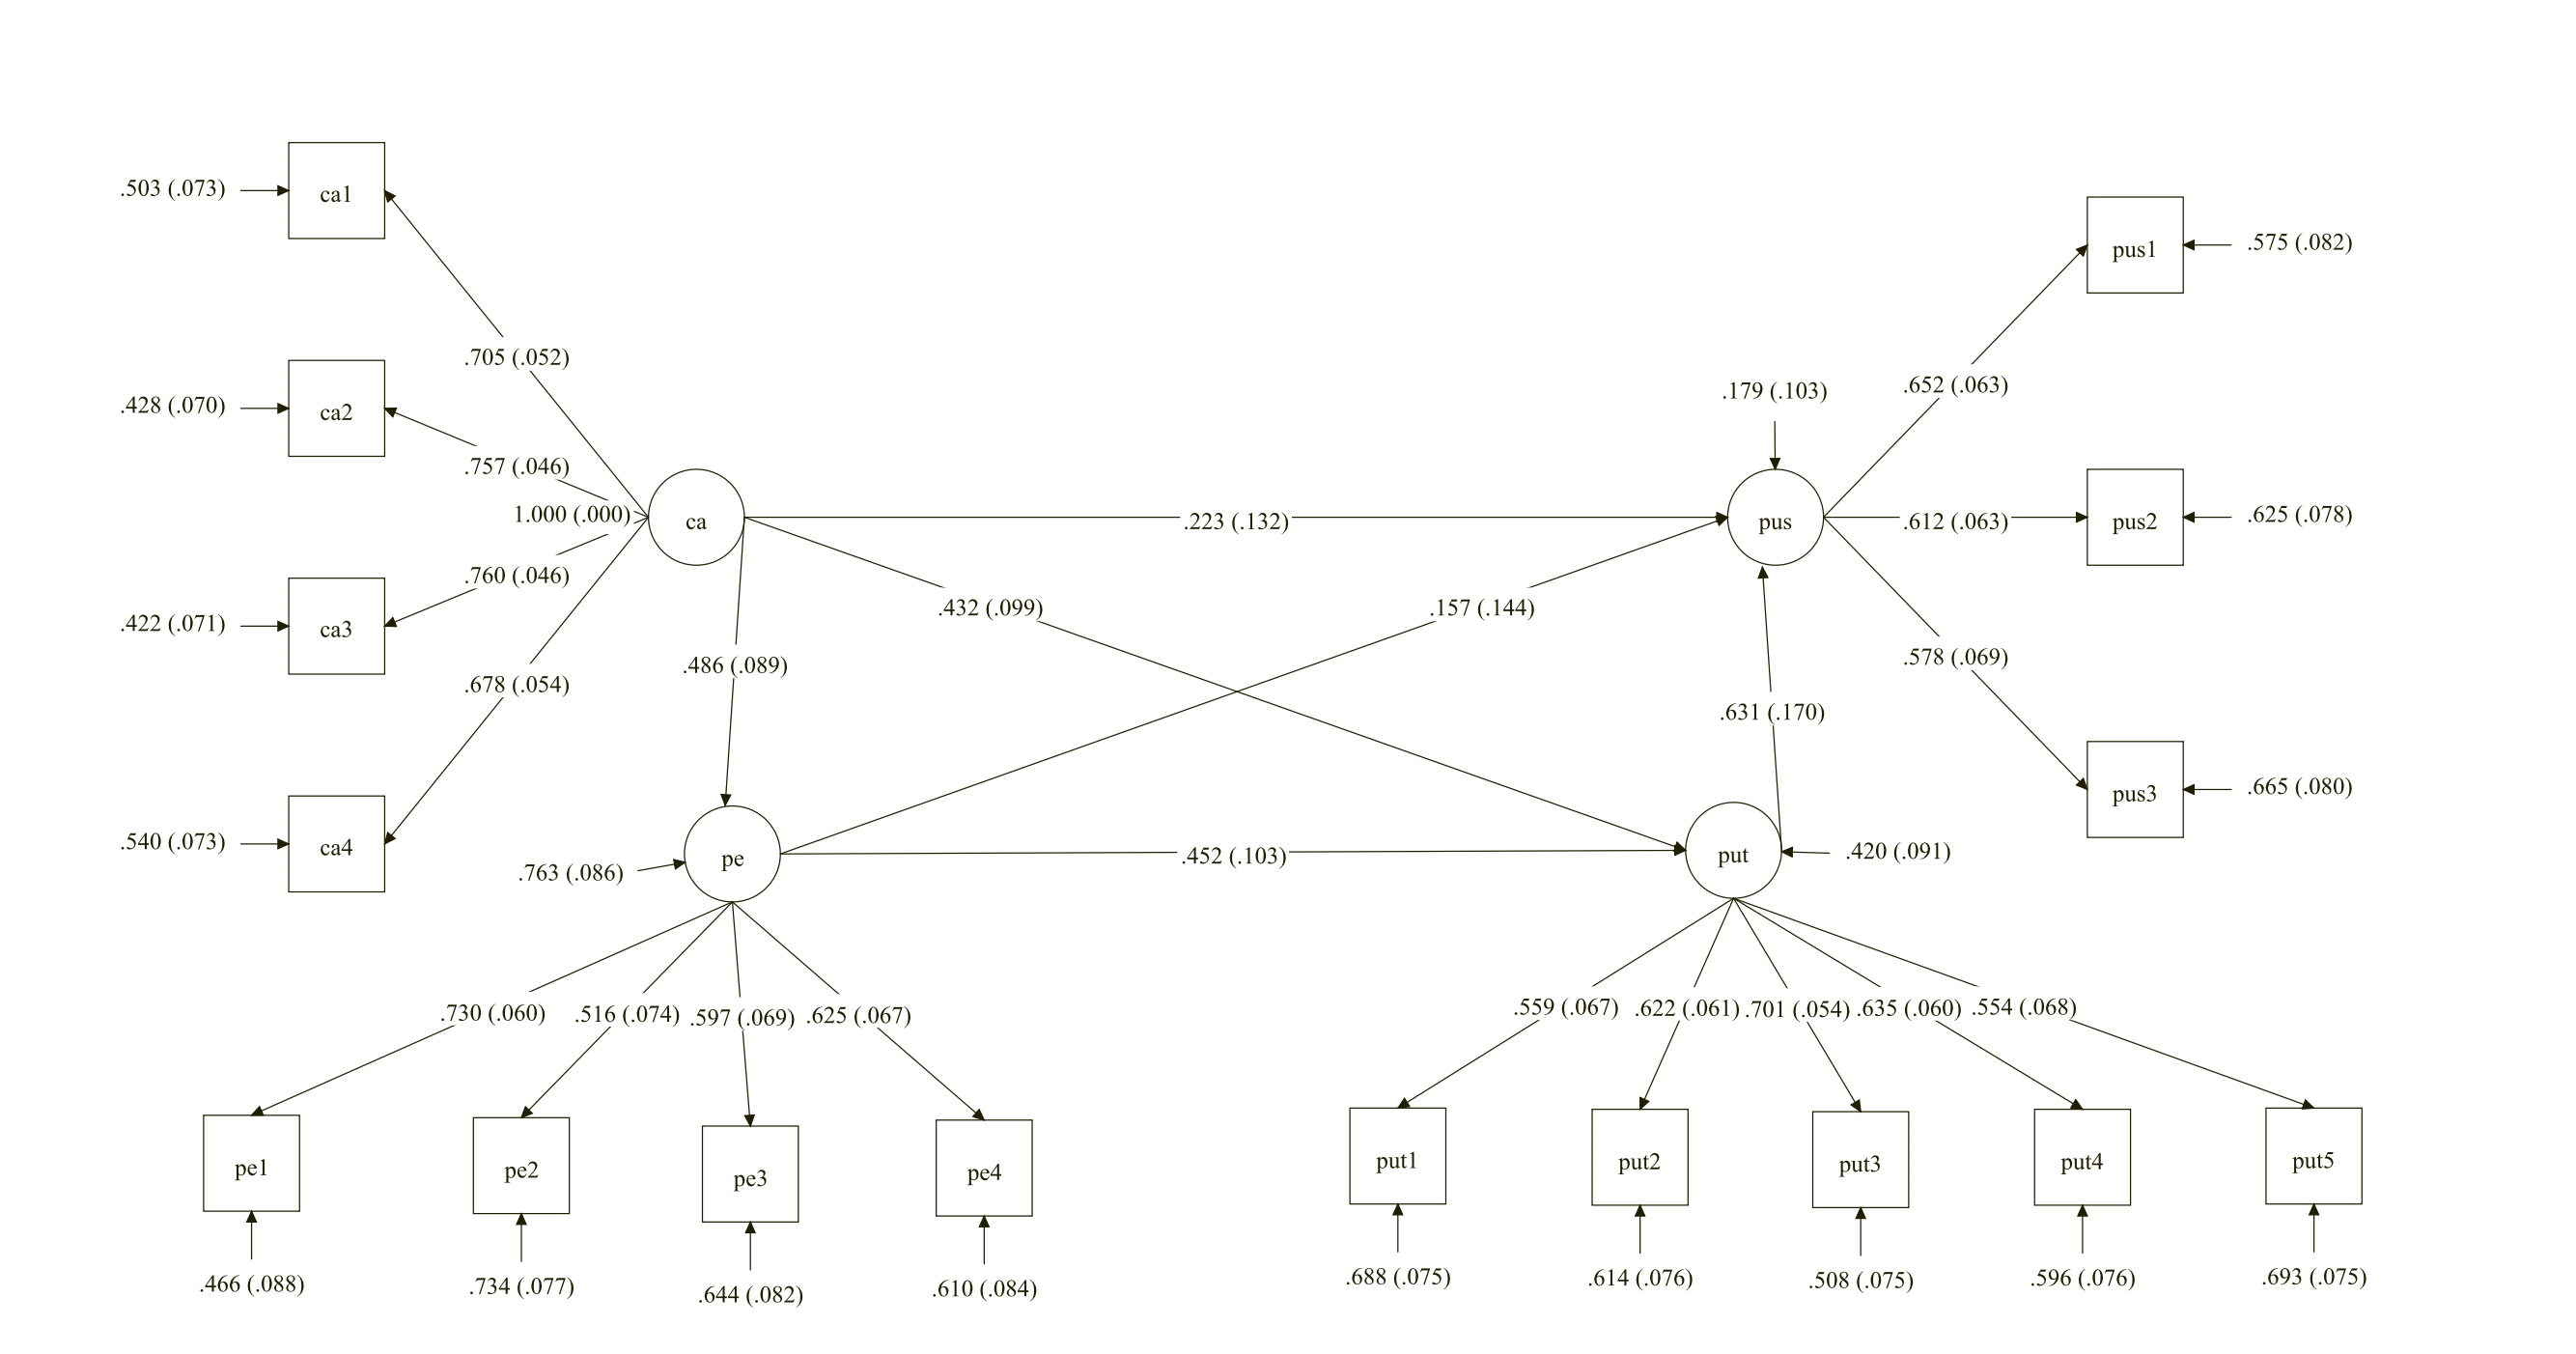
Before conducting SEM to verify research hypotheses, we did confirmatory factor analysis to ensure the construct validity of factors. As Table 4 shows, all four factors have a reasonable fit to the data. Figure 2 illustrates the path diagram of the model with standardized coefficients and standard errors of each estimated coefficient. The overall model showed good fit considering several fit indices:
(98) =122.168, CFI = 0.965, TLI = 0.957, SRMR = 0.049, and RMSEA = 0.041. In Table 5, path coefficients of direct effects and indirect effects were reported.
As predicted in Hypothesis 1, CA has a positive medium effect on PE (0.436) and PUT (0.432). Both effects were statistically significant (p<0.001). However, the direct effect of CA on PUS was not statistically significant (0.223, p=0.091). PE showed a significant and positive moderate effect on PUT (0.452, p<0.001), but had non-significant effect on PUS (0.157, p=0.275). PUT showed a significantly positive medium-large effect on PUS (0.631, p<0.001). Even though CA did not have a significant direct effect on PUS, it affects PUS indirectly by influencing PE and PUT. Regarding the mediating role of PE and PUT, while PUT had a significant indirect effect on the relationship between CA and PUS (0.272, p=0.006), the indirect effect of PE alone was non-significant (0.076, p=0.284). However, the indirect effect mediated through PE and PUT jointly was statistically significant (0.139, p=0.013).
Discussion
This study investigated how teachers evaluate RIMS, which is a computer-based reading scaffolds for math learning. Most teachers who participated in the tool evaluation responded that using RIMS will help them teach math and improve students’ mathematical knowledge. When considering teachers’ attitudes toward computer use (CA), we found that CA directly or indirectly influences perceived ease of use and usefulness of the tool. This implies that teachers tend to predetermine the usefulness of the technology for their teaching and students’ learning based on their preferences on computer use. This finding can expand the TAM model by explaining how users’ attitudes toward computer use can affect their use of the target technology.
Furthermore, this finding suggested that it is important to support teachers to have positive attitudes toward computer use so that they can integrate technology in their curriculum and instruction. However, even though teachers are aware of the value of adopting technology regardless of their years of teaching experience (Pierce & Ball, 2009; Baek et al., 2008), many of them feel reluctant to use new technology due to lack of resources, professional development opporutnity, competence in technology use, expense and time (Pelgrum, 2001; Pierce & Ball, 2009). In future studies, we need more research about how we can improve teachers’ positive attitudes toward computer use and new technology as well. Moreover, there should be more exploration on technology integration in teaching practices and students’ learning outcomes.
References
Adams, T. L. (2003). Reading mathematics: More than words can say. Reading Teacher, 56, 786–795.
Askar, P., & Umay, A. (2001). Preservice elementary mathematics teachers’ computer self-efficacy, attitudes towards computers, and their perceptions of computer-enriched learning environments. In Society for Information Technology & Teacher Education International Conference.
Azevedo, R. (2005). Using hypermedia as a metacognitive tool for enhancing student learning? The role of self-regulated learning. Educational Psychologist, 40(4), 199-209.
Baek, Y., Jung, J., & Kim, B. (2008). What makes teachers use technology in the classroom? Exploring the factors affecting facilitation of technology with a Korean sample. Computers & Education, 50(1), 224-234.
Belland, B. R., Walker, A. E., & Kim, N. J. (2017). A Bayesian network meta-analysis to synthesize the influence of contexts of scaffolding use on cognitive outcomes in STEM education. Review of Educational Research, 87(6), 1042-1081.
Bortnem, G. (2008). Teacher use of interactive read alouds using nonfiction in early childhood classrooms. Journal of College Teaching & Learning, 5(12), 29-44.
Bowers, P. N., Kirby, J. R., & Deacon, S. H. (2010). The effects of morphological instruction on literacy skills: A systematic review of the literature. Review of Educational Research, 80(2), 144-179.
Carlisle, J. F. (2010). Effects of instruction in morphological awareness on literacy achievement: An integrative review. Reading Research Quarterly, 45(4), 464-487.
Davis, F. (1989). Perceived usefulness, perceived ease of use, and user acceptance of information technology. MIS Quarterly, 13, 319 – 340.
Davis, F. D., Bagozzi, R. P., & Warshaw, P. R. (1989). User acceptance of computer technology: a comparison of two theoretical models. Management Science, 35(8), 982-1003.
Davis, F. D. (1993). User acceptance of information technology: system characteristics, user perceptions and behavioral impacts. International Journal of Man-machine Studies, 38(3), 475-487.
Fang, Z., & Schleppegrell, M. (2010). Disciplinary literacies Across content areas: Supporting secondary reading through functional language analysis. Journal of Adolescent & Adult Literacy: A Journal from the International Reading Association 53(7): 587–597.
Galasso, S. (2019). When Literacy and Mathematics Collide: Supporting Reading in Your Math Class. Carnegie Learning.
Halliday, M. A. K. (1978). Language as social semiotic: The social interpretation of language and meaning. Hodder Arnold.
Heffernan, N. T., & Heffernan, C. L. (2014). The ASSISTments Ecosystem: Building a platform that brings scientists and teachers together for minimally invasive research on human learning and teaching. International Journal of Artificial Intelligence in Education, 24(4), 470-497.
Koedinger, K. R., & Aleven, V. (2007). Exploring the assistance dilemma in experiments with cognitive tutors. Educational Psychology Review, 19(3), 239-264.
Land, S. M. (2000). Cognitive requirements for learning with open-ended learning environments. Educational Technology Research and Development, 48(3), 61-78.
Magliano, J. P., Millis, K. K., Ozuru, Y., & McNamara, D. S. (2007). A multidimensional framework to evaluate reading assessment tools. In D. S. McNamara (Ed.), Reading comprehension strategies: Theories, interventions, and technologies (pp. 107–136). Mahwah, NJ: Erlbaum.
Mayer, R. E. (2004). Should there be a three-strikes rule against pure discovery learning?. American Psychologist, 59(1), 14-19.
McNamara, D. S., & Kendeou, P. (2011). Translating advances in reading comprehension research to educational practice. International Electronic Journal of Elementary Education, 4(1), 33–46.
Mendicino, M., Razzaq, L., & Heffernan, N. T. (2009). A comparison of traditional homework to computer-supported homework. Journal of Research on Technology in Education, 41(3), 331-359.
Meyer, B. J., & Ray, M. N. (2017). Structure strategy interventions: Increasing reading comprehension of expository text. International Electronic Journal of Elementary Education, 4(1), 127-152.
Meyer, B. J., Wijekumar, K., & Lei, P. (2018). Comparative signaling generated for expository texts by 4th–8th graders: variations by text structure strategy instruction, comprehension skill, and signal word. Reading and Writing, 31(9), 1937-1968.
Ngai, E. W., Poon, J. K. L., & Chan, Y. H. (2007). Empirical examination of the adoption of WebCT using TAM. Computers & Education, 48(2), 250-267.
Ozuru, Y., Dempsey, K., & McNamara, D. S. (2009). Prior knowledge, reading skill, and text cohesion in the comprehension of science texts. Learning and Instruction, 19(3), 228-242.
Pelgrum, W. J. (2001). Obstacles to the integration of ICT in education: results from a worldwide educational assessment. Computers & Education, 37(2), 163-178.
Phillips, L. A., Calantone, R., & Lee, M. T. (1994). International technology adoption. Journal of Business & Industrial Marketing. 9(2), 16-28.
Pierce, R., & Ball, L. (2009). Perceptions that may affect teachers’ intention to use technology in secondary mathematics classes. Educational Studies in Mathematics, 71(3), 299-317.
Pimm, S. L., & Rice, J. C. (1987). The dynamics of multispecies, multi-life-stage models of aquatic food webs. Theoretical Population Biology, 32(3), 303-325.
Scammacca, N. K., Roberts, G. J., Cho, E., Williams, K. J., Roberts, G., Vaughn, S. R., & Carroll, M. (2016). A century of progress: Reading interventions for students in grades 4–12, 1914–2014. Review of Educational Research, 86(3), 756-800.
Segedy, J. R., Kinnebrew, J. S., & Biswas, G. (2011, November). Modeling learner’s cognitive and metacognitive strategies in an open-ended learning environment. In 2011 AAAI Fall Symposium Series.
Shanahan, C., T. Shanahan, and C. Misischia. 2011. Analysis of expert readers in three disciplines history, mathematics, and chemistry. Journal of Literacy Research 43 (4): 393–429.
Teo, T., & Van Schalk, P. (2009). Understanding technology acceptance in pre-service teachers: A structural-equation modeling approach. Asia-Pacific Education Researcher, 18(1), 47-66.
Vanlehn, K. (2006). The behavior of tutoring systems. International Journal of Artificial Intelligence in Education, 16(3), 227-265.
Appendix A (Figures)
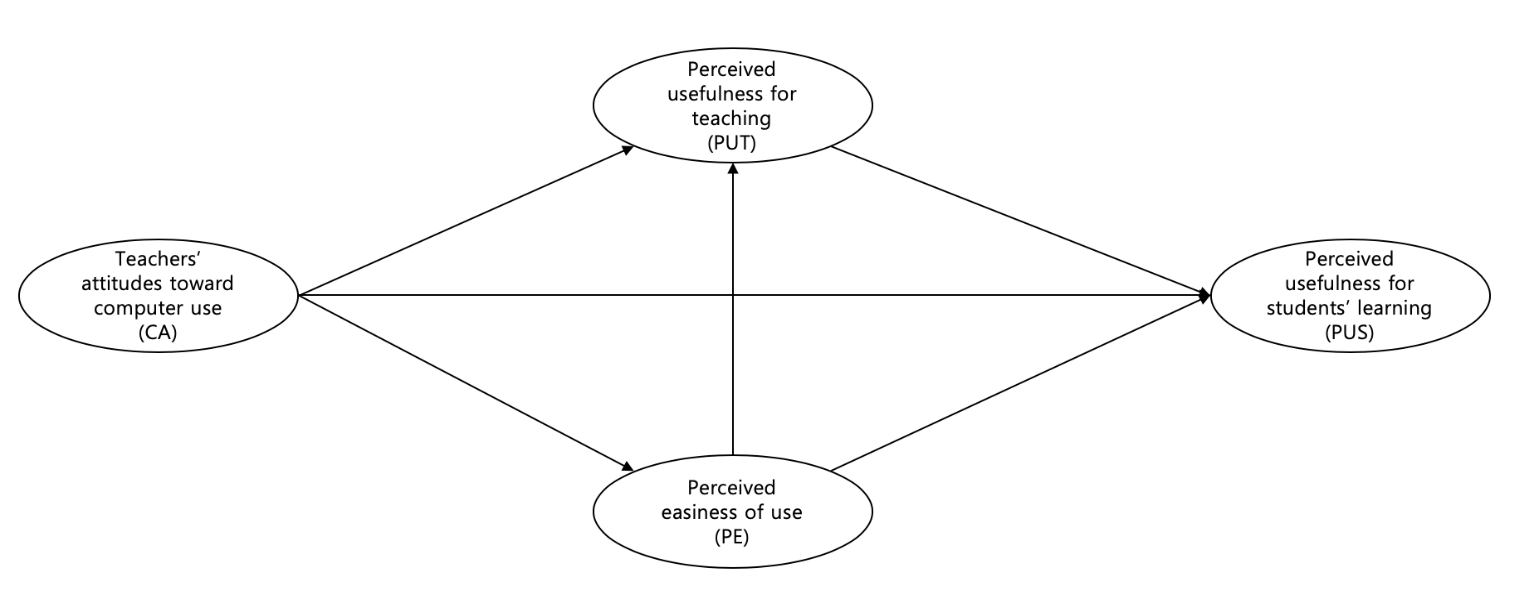
Fig 1. The relationship among CA, PE, PUT, and PUS
 CAPEPUTPUS
Fig 2. The SEM model
Appendix B (Tables).
Table 1
Survey questions and the reliability of the tool evaluation survey
|
Category |
Cronbach alpha |
Statement |
|
Affect toward Computer use (CA) |
0.81 |
CA1. Computers make my teaching work more interesting. CA2. Working with computers is fun. CA3. I like using computers. CA4. I look forward to those aspects of my job that require me to use computers. |
|
Perceived ease of use (PE) |
0.73 |
PE1. My interaction with this tool is clear and understandable. PE2. I find it easy to get this tool to do what I want it to do. PE3. Interacting with this tool does not require a lot of mental effort. PE4. I find this tool easy to use. |
|
Perceived usefulness for teaching (PUT) |
0.75 |
PUT1. Using this tool will improve my overall teaching practices. PUT2. Using this tool will help me deliver the given content effectively. PUT3. Using this tool will help me prepare to teach the given content before the class. PUT4. Using this tool will help me teach mathematical concepts effectively. PUT5. Using this tool will help me teach how to solve math problems effectively. |
|
Perceived usefulness for students’ learning (PUS) |
0.71 |
PUS1. Using this tool will improve students’ learning outcomes. PUS2. Using this tool will help students learn mathematical concepts effectively. PUS3. Using this tool will help students learn effectively how to solve math problems related to the given content. |
Table 2.
Descriptive statistics of survey items
|
Category |
Variable |
Mean |
SD |
Min |
Max |
|
Affect toward computer use (CA) |
CA1 |
3.79 |
1.01 |
1 |
5 |
|
CA2 |
3.71 |
0.99 |
1 |
5 |
|
|
CA3 |
3.75 |
1.02 |
1 |
5 |
|
|
CA4 |
3.89 |
0.90 |
1 |
5 |
|
|
Perceived ease of use (PE) |
PE1 |
4.22 |
0.77 |
2 |
5 |
|
PE2 |
4.20 |
0.81 |
1 |
5 |
|
|
PE3 |
4.24 |
0.73 |
2 |
5 |
|
|
PE4 |
4.26 |
0.74 |
1 |
5 |
|
|
Perceived usefulness for teaching (PUT) |
PUT1 |
4.03 |
0.84 |
2 |
5 |
|
PUT2 |
4.06 |
0.83 |
1 |
5 |
|
|
PUT3 |
3.99 |
0.82 |
2 |
5 |
|
|
PUT4 |
3.98 |
0.83 |
2 |
5 |
|
|
PUT5 |
3.99 |
0.81 |
1 |
5 |
|
|
Perceived usefulness for students (PUS) |
PUS1 |
4.16 |
0.76 |
1 |
5 |
|
PUS2 |
4.24 |
0.82 |
2 |
5 |
|
|
PUS3 |
4.12 |
0.79 |
1 |
5 |
|
Table 3
Frequency and percentage of responses for each survey item
|
Variable |
Strongly Disagree |
Disagree |
Neither disagree nor agree |
Agree |
Strongly Agree |
|
|
|
|
|
|
|
|
n (%) |
n (%) |
n (%) |
n (%) |
n (%) |
|
|
CA |
16 (2.66) |
49 (8.15) |
112 (18.64) |
261 (43.43) |
163 (27.12) |
|
CA1 |
6 (4.05) |
11 (7.43) |
25 (16.89) |
72 (48.65) |
34 (22.97) |
|
CA2 |
3 (2.03) |
14 (9.46) |
40 (27.03) |
56 (37.84) |
35 (23.65) |
|
CA3 |
5 (3.38) |
13 (8.78) |
31(20.95) |
63 (42.57) |
36 (24.32) |
|
CA4 |
2 (1.35) |
11 (7.43) |
16 (10.81) |
70 (47.30) |
58 (39.19) |
|
PE |
2 (0.34) |
10 (1.69) |
78 (13.18) |
259 (43.75) |
243 (41.05) |
|
PE1 |
|
4 (2.70) |
19 (12.84) |
65 (43.92) |
60 (40.54) |
|
PE2 |
1 (0.68) |
2 (1.35) |
25 (16.89) |
57 (38.51) |
63 (42.57) |
|
PE3 |
|
2 (1.35) |
20 (13.51) |
66 (44.59) |
60 (40.54) |
|
PE4 |
1 (0.68) |
2 (1.35) |
14 (9.46) |
71 (47.97) |
60 (40.54) |
|
PUT |
2 (0.27) |
39 (5.27) |
119 (16.08) |
369 (49.86) |
211 (28.51) |
|
PUT1 |
|
10 (6.76) |
19 (12.84) |
75 (50.68) |
44 (29.73) |
|
PUT2 |
1 (0.68) |
6 (4.05) |
23 (15.54) |
71 (47.97) |
47 (31.76) |
|
PUT3 |
|
10 (6.76) |
20 (13.51) |
79 (53.38) |
39 (26.35) |
|
PUT4 |
|
7 (4.73) |
31 (20.95) |
68 (45.95) |
42 (28.38) |
|
PUT5 |
1 (0.68) |
6 (4.05) |
26 (17.57) |
76 (51.35) |
39 (26.35) |
|
PUS |
3 (0.68) |
15 (3.38) |
45 (10.14) |
218 (49.10) |
163 (36.71) |
|
PUS1 |
2 (1.35) |
3 (2.03) |
12 (8.11) |
82 (55.41) |
49 (33.11) |
|
PUS2 |
|
5 (3.38) |
21 (14.19) |
55 (37.16) |
67 (45.27) |
|
PUS3 |
1 (0.68) |
7 (4.73) |
12 (8.11) |
81 (54.73) |
47 (31.76) |
Table 4
Fit indices for Factors
|
Factors |
x2
(df) |
RMSEA |
CFI |
TLI |
SRMR |
|
CA |
192.825 (6) |
0.01 |
0.99 |
0.98 |
0.03 |
|
PE |
121.723(6) |
0.051 |
0.98 |
0.97 |
0.028 |
|
PUT |
151.083 (10) |
0.018 |
0.90 |
0.90 |
0.03 |
|
PUS |
82.802(3) |
0.045 |
0.92 |
0.93 |
0.02 |
Table 5
Path Coefficients of Direct and Indirect effects of the Model
|
|
Path Coefficients |
|||
|
|
Direct effects |
Indirect effects |
||
|
|
To PE |
To PUT |
To PUS |
|
|
CA |
0.486*** |
0.432*** |
0.223 |
|
|
PE |
|
0.452*** |
0.157 |
|
|
PUT |
|
|
0.631*** |
|
|
CAPEPUS |
|
|
|
0.076 |
|
CAPUTPUS |
|
|
|
0.272** |
|
CAPEPUTPUS |
|
|
|
0.139** |
*** p≤0.001, **p≤0.01, *p≤ 0.05